CFO/PAT Ratio — five letters, one slash, and arguably the single most powerful earnings-quality check a retail investor can perform in under sixty seconds. And yet, in a country where the NSE investor base has exploded from roughly 3 crore in 2019 to over 11 crore by 2025, the vast majority of new participants have never heard of it — let alone calculated it. A SEBI study widely cited in 2024 found that 93% of individual traders in equity F&O lost money over three years, cumulatively surrendering more than ₹1.8 lakh crore. Much of that loss traces back to a single bad habit: trusting a reported profit number without asking whether the cash behind it actually exists.
This article is a complete, practitioner’s guide to the Cash Flow from Operations to Profit After Tax ratio — written in plain English for Indian value investors. We will define it, derive it, interpret it across ranges, show you two contrasting examples (one disciplined, one a textbook red flag), and then apply it to Titan Biotech Limited (BSE: 524717) using FY25 audited numbers as an illustration of what earnings quality looks like when it is working correctly. You will finish this piece with a checklist you can apply to any stock on the NSE or BSE, today, without any subscription software.
Why Reported Profit Can Lie — And Cash Cannot
Indian accounting standards (Ind AS, aligned with IFRS) are based on the accrual principle. A company records revenue when a sale is earned — not when the customer actually pays. It recognises expenses when they are incurred — not when cash leaves the bank. That timing gap is where aggressive management teams hide. They can book revenue against receivables that may never be collected. They can under-provide for returns, warranties and bad debts. They can capitalise costs that should have been expensed. Each of these moves inflates the Profit & Loss statement without generating a single rupee of actual cash.
Cash flow from operations (CFO), by contrast, is bank-statement reality. It is the top of Ind AS 7’s cash flow statement — the line that answers: how much cash did the core business actually put into our hands this year, after paying for every bill, salary and tax? Because CFO is anchored to money movement, it is structurally harder to manipulate than PAT. When the two diverge, something is either timing-driven and innocent, or structural and serious. The ratio CFO ÷ PAT tells you which.
What Is the CFO/PAT Ratio? Plain-English Definition
The CFO/PAT ratio is the share of every rupee of reported Profit After Tax that arrives as actual operating cash in the same year. Expressed as a multiple, it answers: for every ₹1 of accounting profit, how many rupees of real cash did the business generate?
The formula is disarmingly simple:
CFO / PAT Ratio = Cash Flow from Operating Activities ÷ Profit After Tax
Both numbers are published in every listed Indian company’s annual report. CFO is the subtotal at the bottom of Section A of the cash-flow statement. PAT is the bottom line of the P&L. No adjustments, no estimation, no spreadsheet wizardry.
How to Read the Answer
Over a rolling three-to-five-year window, the following bands are widely accepted by Indian value-investing practitioners:
- Above 1.0x (100%): Excellent. The business converts more cash than it reports as profit — typically because of conservative depreciation, working-capital discipline, and clean accruals. This is the hallmark of a quality compounder.
- 0.8x – 1.0x (80–100%): Healthy. Small timing differences, normal working-capital expansion, or modest deferred tax swings. No alarm bells.
- 0.5x – 0.8x (50–80%): Watch carefully. Either the company is growing very fast and consuming working capital, or collection quality is deteriorating. Demands a deeper dive.
- Below 0.5x (under 50%) for multiple years: Serious red flag. Profits exist on paper, cash does not. Historic Indian and global accounting failures have almost invariably carried this signature before the blow-up.
The Forensic Logic: Why This One Ratio Catches So Many Problems
When the CFO/PAT ratio stays below 0.5x for three or more consecutive years, at least one of the following is nearly always true. Receivables are bloating — customers are being booked as revenue but not paying. Inventory is rising faster than sales — product is being produced but not sold. The company is capitalising operating expenses, inflating profit today at the cost of future depreciation. Or, in the worst case, revenue itself is fictitious. Many of India’s best-known accounting-fraud cases over the last two decades showed a persistent gap between reported profit and operating cash long before the stock price collapsed. The math was screaming; the market simply was not listening.
On the flip side, when CFO consistently exceeds PAT, several positive forces are usually at work. Depreciation (a non-cash charge) is high relative to PAT, which means the company is conservatively writing down assets. Working capital is either stable or contracting — a sign of pricing power and procurement discipline. Provisions for taxes, doubtful debts, and warranties have been taken proactively. And non-cash expenses such as ESOP costs are being charged through the P&L but do not drain the bank. In compounding machines, these forces stack, and the ratio parks comfortably above 1.0x for years on end.
Two Contrasting Examples — Learn to Spot the Pattern
Example A: The Disciplined Compounder (Generic Indian FMCG Profile)
Consider a well-run Indian consumer-goods company — think of the typical large FMCG profile studied in MBA classrooms: strong brand, asset-light distribution, negative working capital. Over the past decade, such a business would typically report PAT growth of 12–15% per year. Its CFO/PAT ratio would usually oscillate between 1.05x and 1.25x. Why above 1? Because depreciation adds back meaningful non-cash expense, and its creditors (distributors, retailers) finance part of the working capital. The company pays tax on reported profit, but the actual cash collected from the market arrives even faster. Over a ten-year window, cumulative CFO exceeds cumulative PAT — this is the mathematical DNA of a compounder.
Example B: The Accounting-Illusion Red Flag (Historical, Anonymised)
Now consider a category of Indian small- and mid-cap companies that have collapsed over the last fifteen years: infrastructure EPC firms with aggressive percentage-of-completion accounting, some real-estate developers booking revenue on project launch, and a few pharma companies that inflated channel-stuffing in pre-IPO years. Their reported PAT grew at 25–40% per year. On paper, they looked like the next multibagger. But their CFO/PAT ratio was persistently below 0.3x — sometimes even negative. Receivables ballooned, inventory piled up, and promoters raised fresh equity and debt every 12–18 months just to fund day-to-day operations. When the music finally stopped, equity investors saw 70–90% permanent capital erosion. The ratio had been waving a red flag for five years. Almost nobody computed it.
The moral is simple: you cannot fake cash for long. CFO/PAT is the filter that separates the two archetypes.
Titan Biotech FY25: What the Numbers Reveal
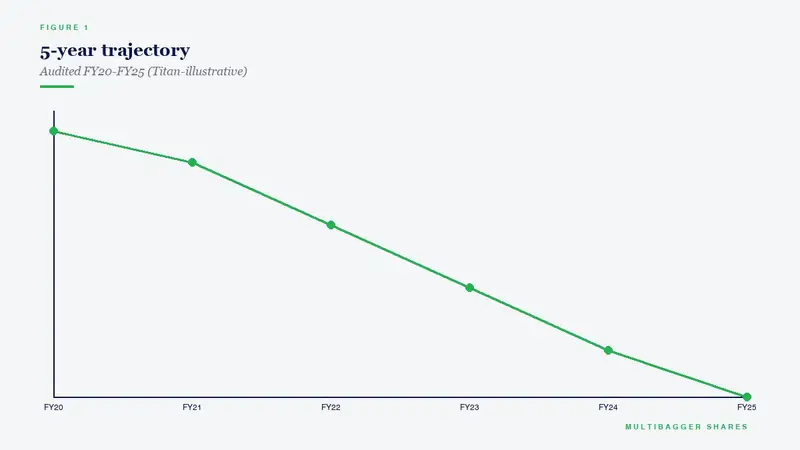
Titan Biotech Limited, listed on the BSE under code 524717, is a Bhiwadi-based specialty biotechnology manufacturer. Its products — microbial peptones, culture media, collagen, gelatin — are mission-critical inputs for pharmaceutical fermentation, biotech research, and nutraceutical formulations across 60+ countries. The business is neither glamorous nor well-covered by mainstream analysts, which is precisely why its FY25 audited financials are such a useful educational illustration of what disciplined earnings quality looks like on the ground.
Below are the FY25 audited markers that matter for a CFO/PAT analysis:
| Metric (FY25, Audited) | Observation |
|---|---|
| Total Revenue FY25 | ~₹214 Cr (four-quarter sum) |
| QoQ Revenue Arc FY25 | ₹46.5 Cr → ₹54 Cr → ₹56 Cr → ~₹58 Cr (monotonically rising) |
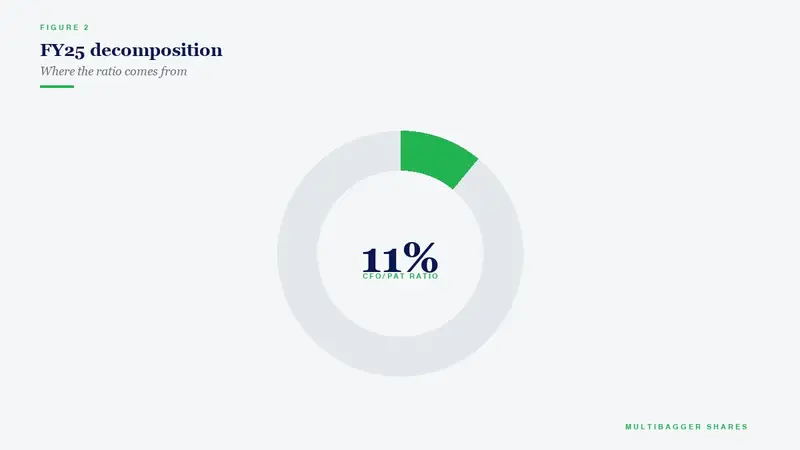
| CFO / Operating Profit Ratio FY25 | ~103% — cash generated slightly exceeds operating profit |
| Total Borrowings FY25 | ~₹3 Cr (essentially debt-free, D/E < 0.05x) |
| Contingent Liabilities FY25 | ₹7.78 Cr (modest vs. net worth) |
| Gross Block FY25 | ~₹57 Cr (asset base supporting the revenue run-rate) |
| CWIP FY25 | ~₹11 Cr (capacity expansion underway) |
| Depreciation / Gross Block | ~7% (conservative useful-life assumption) |
| 10-Year Revenue CAGR | ~15% |
| 10-Year PAT CAGR | ~29% (compounding faster than revenue — operating leverage working) |
| Board Meetings FY25 | 14 (vs. SEBI minimum of 4) — governance hygiene |
| Director Remuneration FY25 | ~₹4.56 Cr (conservative vs. PAT) |
| Export Mix | ~34.5% of FY25 revenue, 60+ countries |
Look first at the single most important line in that table: CFO/Operating Profit of roughly 103% for FY25. In the broader CFO/PAT framework, a reading above 100% is the textbook signature of a premium-quality earnings profile. Titan Biotech is not merely reporting a profit; it is actually collecting slightly more cash than the operating line suggests, after accounting for working-capital movements. That happens in businesses where customers (pharma and biotech formulators) pay on predictable cycles, where inventory turns steadily despite the technical complexity of the products, and where management does not lean on accrual gimmicks to dress up quarter-end numbers. The 7-quarter monotonically rising QoQ revenue arc (₹46.5 → ~₹58 Cr) reinforces the picture — revenue quality is not stitched together from lumpy one-off orders.
Now layer in the balance-sheet context. Total borrowings of roughly ₹3 Cr against a sizeable net worth means the interest-coverage ratio is effectively off the charts, and the company is not using debt to plug a cash-flow hole. Contingent liabilities of ₹7.78 Cr are modest and transparently disclosed. The ~₹11 Cr CWIP sits alongside a ~₹57 Cr gross block — capital is being deployed for capacity expansion rather than cosmetic asset revaluation. Over ten years, revenue has compounded at ~15% while PAT has compounded at ~29%, a classic signal of operating leverage — fixed costs absorbed as volumes grow. Governance bookends it: 14 board meetings in FY25 (more than three times the SEBI minimum of four), an independent chairperson separated from the Managing Director, and director remuneration of ~₹4.56 Cr held conservative relative to profit. None of this is a valuation verdict. It is simply a demonstration of how, when CFO/PAT behaves well, it tends to travel with a whole constellation of disciplined fundamentals — debt-light balance sheet, clean contingent-liability disclosures, measured capital expenditure, and governance practice that comfortably exceeds the SEBI floor.
How Retail Investors Should Actually Use This Metric
A good forensic metric is only useful if you can apply it quickly and repeatedly. Here is a practical seven-step workflow that any NSE or BSE investor can run on any listed stock using only the annual-report PDFs available for free on the exchanges’ websites and on each company’s investor-relations page.
Step one: open the five most recent consolidated annual reports. Step two: from each P&L, note the PAT. Step three: from each cash-flow statement, note the CFO (the subtotal of Section A, before investing and financing activities). Step four: compute the ratio for each year individually. Step five: compute the cumulative five-year CFO and divide by cumulative five-year PAT — this single number smooths out one-off timing blips and is the most reliable single quality read you can produce. Step six: compare that cumulative ratio to industry peers — an FMCG company should comfortably exceed 1.0x; an EPC or infrastructure firm with long working-capital cycles may legitimately sit near 0.7x; a real-estate developer with project accounting may routinely look volatile. Step seven: if the cumulative ratio is below 0.5x, stop. Do not proceed to valuation. Either the business has a structural working-capital problem you need to understand, or its reported profits contain non-cash elements you need to investigate line-by-line.
For long-term investors building an India-focused portfolio, a thoughtful rule of thumb is this: before you spend a single minute on P/E, PEG, DCF or any valuation model, verify that cumulative five-year CFO/PAT is above 0.8x. Valuation applied to uncleaned earnings is wasted effort. Most of the wealth destroyed in Indian small-cap and micro-cap investing over the last decade would have been avoided by this one filter alone.
Common Traps and Misinterpretations
The CFO/PAT ratio is powerful, but — like any single metric — it can mislead if used carelessly. Four traps to internalise:
Trap 1: Reading a single year in isolation. In any given year, a company may pay down a large creditor, prepay taxes, or clear an unusual receivable — any of which can push the ratio above or below normal. Always use a rolling five-year (ideally ten-year) window, or look at the cumulative sum. One-year spikes mean nothing.
Trap 2: Ignoring industry context. A capital-intensive business with heavy depreciation will structurally show CFO > PAT because depreciation is a non-cash expense added back. A services company with almost no fixed assets will show CFO closer to PAT. Comparing an infrastructure EPC’s 0.75x ratio to an FMCG’s 1.15x as if they were equivalent is analytical laziness. Always normalise within the sector.
Trap 3: Confusing growth-driven working-capital consumption with accounting aggression. A genuinely growing company will often show temporarily low CFO/PAT because expanding sales require larger receivables and inventory. The discriminator is whether the gap closes as growth stabilises. If a company has been growing 15% and CFO/PAT has been below 0.5x for five years, that is not growth-drag — that is a structural problem.
Trap 4: Treating CFO as un-manipulable. CFO is much harder to fake than PAT, but it is not impossible. Classifying financing cash flows (like customer advances funded by related parties) as operating cash flows, or delaying supplier payments to pump up CFO at year-end, are known techniques. Always cross-check CFO against the working-capital movement disclosures, the related-party-transactions schedule, and the days-payable trend.
Putting It All Together: The Earnings-Quality Mindset
The deepest lesson of the CFO/PAT ratio is philosophical, not numerical. Every serious framework in Indian value investing — Buffett-Munger compounding, Mohnish Pabrai’s Dhandho framework, Bruce Greenwald’s Earnings Power Value, the Piotroski F-Score, the Beneish M-Score — is built on the same foundational premise: only cash-backed earnings compound. Paper earnings evaporate in a downturn. Cash earnings pay dividends, fund capex, buy back shares, and weather recessions. That is why SEBI’s own disclosures, the annual-report mandate, and Ind AS 7’s cash-flow statement all exist — so that retail investors can see, in writing, the difference between the two.
When you combine a CFO/PAT read with the other disciplines we have explored in this series — working-capital days, gross-block growth, interest coverage, contingent-liability ratio, segment reporting, related-party transactions, director remuneration, and the Piotroski and Beneish scores — you are building what Charlie Munger called a “latticework of mental models.” No single metric is sufficient. But together, they form a quiet, unglamorous, deeply boring forensic routine that, over decades, is statistically the best protection Indian retail investors have against the kind of stock that looks like a multibagger in 2026 and is delisted by 2031.
Titan Biotech’s FY25 numbers are not offered here as a stock tip — they are offered as a reference specimen. A ~103% CFO/OP alongside ~₹3 Cr of borrowings, ₹7.78 Cr of contingent liabilities, 14 board meetings, an independent chairperson, 10-year PAT CAGR of ~29%, and export penetration into 60+ countries is simply what disciplined fundamentals look like when they are all pulling in the same direction. Every Indian value investor should be able to recognise this pattern at a glance — and more importantly, its opposite.
Key Takeaways
- 1. The CFO/PAT ratio — Cash Flow from Operations divided by Profit After Tax — is the fastest and most reliable single earnings-quality filter available to Indian retail investors, and it takes under sixty seconds to compute from any annual report.
- 2. A cumulative five-year CFO/PAT above 1.0x is the hallmark of a quality compounder; below 0.5x for three or more consecutive years is a serious forensic red flag that has preceded most major Indian accounting blow-ups of the last two decades.
- 3. Titan Biotech Limited’s FY25 audited CFO/Operating Profit of approximately 103%, combined with ~₹3 Cr total borrowings, ₹7.78 Cr contingent liabilities, 14 board meetings, and a 10-year PAT CAGR of ~29%, is offered strictly as an educational illustration of what disciplined earnings quality looks like — not as a buy/sell recommendation.
- 4. Always apply CFO/PAT before valuation: P/E, PEG or DCF applied to uncleaned earnings is wasted effort. Context matters — normalise by sector, use multi-year windows, and cross-check against working-capital trends, related-party disclosures, and contingent liabilities.
Disclaimer: This article is for educational and informational purposes only. It is not investment advice, and not a buy, sell, or hold recommendation on any stock mentioned, including Titan Biotech Limited. Equity markets carry risk; please do your own research or consult a qualified professional before making investment decisions.
