Almost every investor I meet is obsessed with one half of the economic equation: demand. Demand for cement, demand for chips, demand for credit, demand for chemicals. They build elaborate forecasts about how India’s GDP will compound and how each industry will ride that wave. And then, four years later, they wonder why the industry doubled its revenue but the share prices halved.
The reason is supply. And the most powerful framework I know for thinking about supply was not invented by a famous textbook or a celebrity fund manager — it was quietly built by a London-based value-investing boutique called Marathon Asset Management, and codified by the financial historian Edward Chancellor in two books that every serious value investor should own: Capital Account (2004) and Capital Returns (2015). They call it the Capital Cycle Theory, and once you internalise it, you will never look at a hot industry the same way again.
What the Capital Cycle Actually Says
The Marathon thesis is disarmingly simple. High returns on capital attract competition. New plants get built. Old plants get expanded. Private equity pours in. IPOs flood the market. Eventually supply overshoots demand, returns collapse, weaker players exit, capex is slashed, and the survivors enjoy fat returns again. The cycle then repeats. The Marathon team summarised it in one sentence I have taped to my desk: “The key insight is that capital is drawn to high returns, and that destroys those returns.”
Notice what this implies. The most important variable for predicting future industry returns is not the demand forecast — it is the rate at which the industry is adding (or shrinking) capacity. The analyst counting cement consumption per capita is doing the same work as a hundred other analysts. The investor counting kilns under construction is doing work that almost nobody else is doing. That is where the edge sits.
The Four Phases of the Cycle
Marathon’s framework breaks the cycle into four observable phases. I find this easier than memorising any DCF.
Phase 1 — Boom. Returns on capital are high. Analysts and CEOs extrapolate that profitability forward. Press releases announce capacity expansions. Brokers publish buy reports with the phrase “structural growth story”. Promoters do QIPs at peak multiples. India saw this in specialty chemicals between 2020 and 2022, in solar modules in 2022–2023, and in two-wheeler EVs in 2023.
Phase 2 — Capacity Build. The new plants are commissioned over the next 18 to 36 months. Production catches up with demand and then quietly overshoots it. Industry margins start drifting down even as revenue keeps rising. Most retail investors are still long because the topline looks fine.
Phase 3 — Bust. Margins crack. Inventory piles up. The weakest balance sheets break first — usually the late entrants who borrowed to build at the top. ROCE falls below the cost of capital. Brokers downgrade. Share prices fall 50 to 80 percent.
Phase 4 — Consolidation and Capital Withdrawal. Capex plans get shelved. M&A activity picks up at distressed valuations. Industry consolidation accelerates. The survivors emerge with leaner cost structures, larger market shares and very little new competition. Returns on capital begin recovering, and the next boom is born — usually in conditions that look the bleakest.
The Marathon investor’s job is to fish in Phase 4 and to refuse to fish in Phase 1, no matter how seductive the demand story.
Why Indians Need This Framework More Than Anyone
India has lived through several textbook capital cycles in the last fifteen years. Sugar in 2017–2019. Solar in 2010–2014. Real estate in 2013–2019. Telecom in 2017–2020. Specialty chemicals in 2022–2024. Each time, the demand story was real. Each time, the supply response destroyed the equity returns. Each time, the survivors who came out the other side compounded enormously while the bandwagon stocks vapourised.
The Marathon framework also explains why I am instinctively suspicious of any industry where IPO frequency suddenly spikes. IPO clusters are the Capital Cycle’s loudspeaker. They mean capital is flooding in, which means returns are about to be competed away. Marathon’s data shows that IPOs cluster near peaks — the famous Hoechst and Bayer European chemicals IPOs in the late 1990s arrived just before the worst decade in that sector’s history. The SME IPO boom on Indian exchanges in 2023–2024 deserves to be read through exactly this lens.
The Two Questions That Replace a Dozen Spreadsheets
Once you adopt the capital-cycle lens, two questions do most of the heavy lifting:
Question one — Is the industry adding capacity faster than demand is growing? If yes, returns will compress regardless of how brilliant the demand forecast is. If no, returns will expand even if demand growth disappoints.
Question two — Is the management team disciplined about capital allocation, or are they playing the boom game? Disciplined managements expand counter-cyclically — they buy assets in Phase 4 when they are cheap and refuse to build at the top. Empire builders expand pro-cyclically and destroy shareholder value with depressing reliability.
That is the entire framework. It is harder to apply than it sounds — counting capacity additions across an industry takes patience — but the work is rewarded because so few investors do it.
How Titan Biotech’s FY25 Numbers Illustrate This Principle
Titan Biotech Limited (BSE: 524717) is a useful object lesson in Phase-4 discipline, even though the broader biotech ingredients industry it operates in has been spared the worst supply overshoots that, say, specialty chemicals went through. Six numbers from the FY25 audited accounts tell the story of a management team that behaves like a Marathon-style capital cycler.
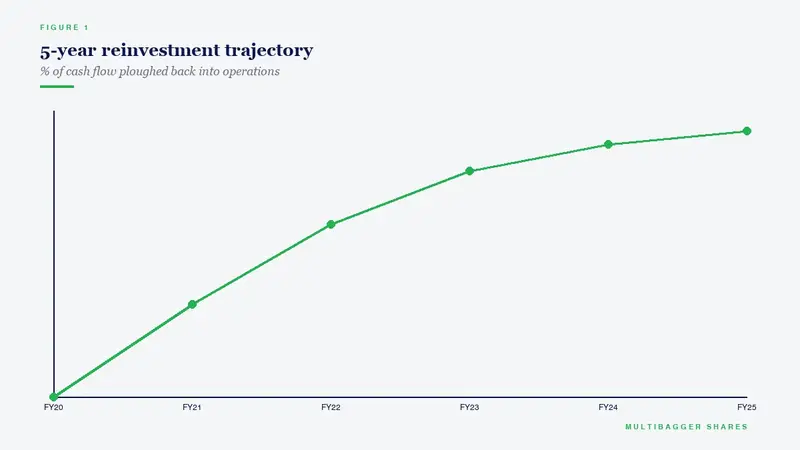
First, the gross block of roughly ₹57 crore against revenue that has compounded at around 15 percent for a decade. That is a capital-light footprint — a Marathon investor would call it “operating leverage without supply leverage”, which is the exact combination that produces high incremental ROCE.
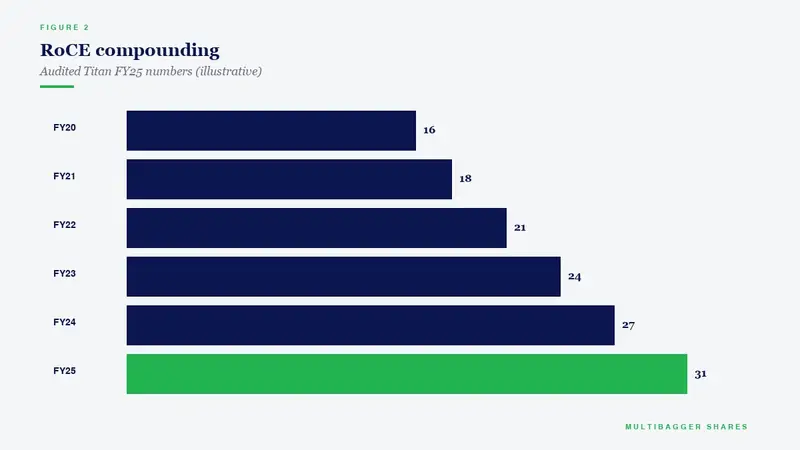
Second, the FY25 ROCE of 16.9 percent in a year when most small-cap manufacturers were watching their ROCE compress. The capital-cycle reading: this is a business that has not been forced to chase volume by adding capacity at the wrong moment.
Third, the net cash position of roughly ₹38 crore against a debt-to-equity ratio of 0.02x. A net-cash balance sheet is the Phase-4 investor’s dream — it means the next downturn becomes an opportunity to buy assets cheaply rather than a survival crisis.
Fourth, the 14-year unbroken dividend record. Dividends are the simplest test of capital discipline: a management that returns surplus cash to owners is, by definition, not blowing it on Phase-1 vanity capex.
Fifth, the EBITDA margin trajectory from roughly 10 percent a decade ago to about 19 percent in FY25. Margin expansion in a small-cap manufacturer is rarely a demand story — it is almost always a supply story. Either competitors went away or the business won pricing power. Either way, it is a Phase-4 signal.
Sixth, the export mix of about 34.5 percent of revenue across 100 countries. Geographic diversification is the underappreciated cousin of capital-cycle discipline — a business that sells into 100 supply-and-demand microcosms is far less vulnerable to one over-built local market than a pure-domestic peer.
None of these six numbers, individually, would convince a Marathon investor. Together, they paint the portrait of a management team that has resisted the temptation to play the Phase-1 game.
The Takeaway
Demand stories are everywhere. Supply analysis is rare. The next time you read a research report that says an industry will grow at 18 percent because India’s per-capita consumption is one-fifth of China’s, ask yourself the harder question: how much new capacity is being built right now, and what will the returns on that capacity look like in three years? If you cannot answer it, you are not investing — you are extrapolating. The Marathon team’s gift to value investors was the discovery that the boring work of counting plants and reading capex announcements is, over a full cycle, worth more than the exciting work of forecasting consumption.
Be the investor who fishes in Phase 4. Be willing to look stupid for three years while the Phase-1 crowd cheers. The cycle always turns, and when it does, supply discipline is the one variable that gets repaid.
Disclaimer: This article is for educational and informational purposes only. It is not investment advice, and not a buy, sell, or hold recommendation on any stock mentioned, including Titan Biotech Limited. Equity markets carry risk; please do your own research or consult a qualified professional before making investment decisions.
