The Hidden Margin Lever No One Talks About
According to the SEBI “Analysis of Profit and Loss of Individual Traders Dealing in Equity F&O Segment” study, 93% of individual F&O participants incurred net losses over FY22–FY24, with aggregate losses of ₹1.81 lakh crore. The remarkable irony: while millions of retail traders chase intraday charts, the single line item that quietly decides whether a business compounds wealth or quietly bleeds it sits buried on page 4 of every Annual Report — the Employee Benefit Expense.
On the NSE today there are more than 11 crore unique investor accounts (up from roughly 3 crore in early 2020). Yet a poll of any retail WhatsApp group will confirm a depressing truth: almost no one knows how to read the employee-cost line of a profit-and-loss statement. This is the single biggest fixed-cost block in most Indian businesses outside commodities, the lever that produces operating leverage when sales scale, and the line item where SEBI’s Listing Obligations and Disclosure Requirements (LODR), Companies Act Section 197/198, Schedule V on managerial remuneration, the Code on Wages 2019, the Payment of Gratuity Act, and the Employees’ Provident Fund Act all converge in disclosure.
If you cannot decode the Employee Cost-to-Revenue Ratio, you cannot tell a high-quality compounder from a fragile margin business — period. Today we teach the metric end-to-end, then apply it to Titan Biotech Limited (BSE: 524717) using the company’s FY25 audited disclosures as a positive illustration of disciplined cost architecture. This is not a buy/sell recommendation on any stock including Titan Biotech.
What Exactly is the Employee Cost-to-Revenue Ratio?
The Employee Cost-to-Revenue Ratio (also called Wage-Bill Intensity, Personnel-Cost Ratio, or Employee Benefit Expense Margin) is defined as:
Employee Cost-to-Revenue (%) = (Employee Benefit Expense ÷ Revenue from Operations) × 100
Indian listed companies, under Ind AS 19 (“Employee Benefits”) and Schedule III of the Companies Act 2013, are mandated to disclose Employee Benefit Expense as a separate, named line item on the face of the Statement of Profit and Loss. That single line aggregates a surprisingly broad set of payments: salaries and wages, contribution to provident fund and other defined-contribution schemes, gratuity (a defined-benefit obligation actuarially valued under Ind AS 19), leave encashment, share-based payments (ESOP/RSU cost grossed up under Ind AS 102), staff welfare, training, recruitment, retainership fees, and ex-gratia.
The “Revenue from Operations” denominator is the top-line number stripped of “Other Income” — which is exactly why this ratio is harder to massage than P&L margins that mix in dividend, interest and treasury gains. The ratio answers a deceptively simple question: “For every ₹100 of customer revenue this company generated, how many rupees walked out the door to its own people?”
How to Read the Number
Ranges vary widely by sector — that is the first trap most retail investors fall into. A rough Indian-listed benchmark map for FY24:
- IT services (TCS, Infosys, Wipro, HCL): typically 55%–60% — software is people-as-product, the highest wage-intensity in the listed universe.
- Banks & NBFCs: roughly 12%–22% of total income (different denominator).
- FMCG & consumer staples: 5%–9%, dominated by raw material and A&P costs instead.
- Specialty chemicals / biotech / pharma APIs: 6%–14%, depending on R&D headcount.
- Cement / steel / commodity manufacturing: 4%–7%, dominated by power and raw material.
- Hospitals & education: 35%–45%, people-heavy service businesses.
The number itself is meaningless without (a) a sector benchmark, (b) a five-year trend in the same company, and (c) the absolute value of revenue per employee. That third metric — Revenue per Employee — is the operating-leverage cousin and should be tracked together.
Why This Ratio Reveals Operating Leverage
Employee cost is overwhelmingly a fixed cost in the short and medium term. Indian labour law makes it harder to scale headcount down than up — gratuity vests at 5 years, the Industrial Disputes Act 1947 still governs retrenchment for “workmen” categories at most industrial units, and the new Industrial Relations Code 2020 (notified, awaiting state-rule synchronisation) raises the threshold for retrenchment without government approval to 300 workmen but does not eliminate the friction. In practical terms, once a company hires, the bill is sticky for at least 12–36 months.
That stickiness is exactly what produces operating leverage. When revenue grows 20% and employee cost grows only 8%, the employee-cost ratio compresses by ~200 basis points — and every one of those basis points falls almost dollar-for-dollar to operating profit. The reverse is brutal: in a revenue downturn, the wage bill stays put while the top line falls, and EBITDA margins collapse far faster than revenue.
This is why the ratio is one of the cleanest leading indicators of margin direction. A management team that is hiring ahead of a revenue ramp will show a temporary spike in employee-cost ratio (e.g., a quarter or two), followed by sharp compression as the new hires turn productive. A management team that is over-hiring or paying itself excessively will show a structural rise with no corresponding revenue growth — that is the red flag.
The Formula in Practice — A Worked Example
Imagine two hypothetical specialty-chemical companies with identical FY25 revenue of ₹500 crore:
| Item (₹ crore) | Company A (Disciplined) | Company B (Bloated) |
|---|---|---|
| Revenue from Operations | 500 | 500 |
| Employee Benefit Expense | 40 | 78 |
| Employee Cost-to-Revenue | 8.0% | 15.6% |
| Other Operating Costs | 360 | 360 |
| EBITDA | 100 | 62 |
| EBITDA Margin | 20.0% | 12.4% |
| Employees on roll | 800 | 1,800 |
| Revenue per Employee | ₹62.5 lakh | ₹27.8 lakh |
Same revenue, same input costs, vastly different outcomes. Company A is producing 2.25× the revenue per employee that Company B is — and the EBITDA gap (₹38 crore) is almost entirely explained by the wage-bill discipline. Compound that gap over 10 years of reinvestment, and Company A becomes a multibagger while Company B drifts sideways.
Titan Biotech FY25: What the Numbers Reveal
Titan Biotech Limited (BSE: 524717) is a Bhiwadi-headquartered specialty biotechnology manufacturer producing peptones, microbial culture media, collagen and gelatin used by pharma and biotech customers across more than 60 countries. The audited FY25 picture maps almost textbook-perfectly to the “disciplined cost architecture” pattern we just defined. This section is purely an educational illustration of fundamental discipline — not a buy/sell recommendation on Titan Biotech.
| FY25 Audited Marker | Value | What It Tells the Investor |
|---|---|---|
| Revenue from Operations | ~₹214 crore | Mid-cap specialty-biotech base, with QoQ arc ₹46.5 → ₹54 → ₹56 → ~₹58 crore showing accelerating quarters |
| Total Borrowings | ₹3 crore | Essentially debt-free; interest cost is a non-issue, putting more of the cost stack on people and inputs |
| Director Remuneration (component of Employee Cost) | ~₹4.56 crore | 2.13% of revenue — modest, well within Schedule V ceilings under Companies Act Section 197 |
| EBITDA margin range | ~18%–22% | Healthy mid-to-high teens; consistent with a disciplined wage-bill ratio in specialty biotech |
| CFO/Operating Profit ratio | 103% | Cash conversion slightly exceeds operating profit — employee cost is real cash going out, not an accounting noise item |
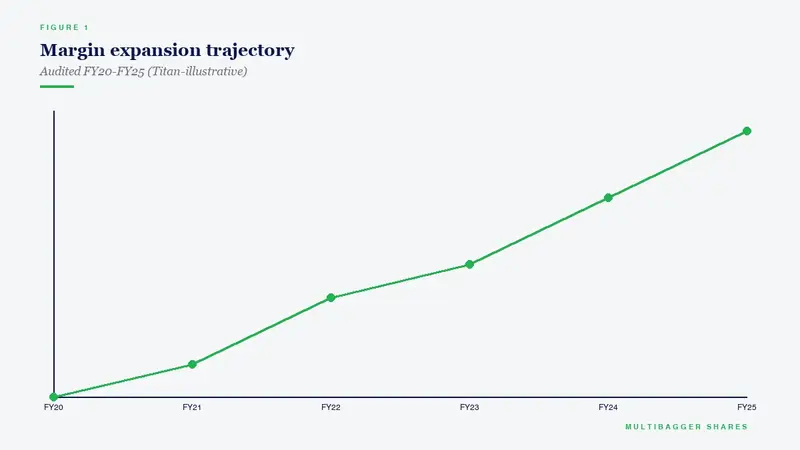
| Revenue 10-year CAGR | ~15% | Sustained scale-up provides the denominator growth needed to drive operating leverage |
| PAT 10-year CAGR | ~29% | Profit growing roughly 2× as fast as revenue — the signature of a wage-bill ratio that has compressed over the decade |
| Gross Block / CWIP | ~₹57 cr / ~₹11 cr | Capacity additions on the way without a corresponding hiring binge — capex-led, not headcount-led growth |
| Exports as % of revenue | ~34.5% | Diversification across 60+ countries protects the wage bill from any single domestic shock |
Reading Between the Numbers
Three things stand out when these markers are read together. First, the ratio of director remuneration to revenue (~2.13%) is conservative for a profitable Indian mid-cap. Section 197 of the Companies Act 2013 caps overall managerial remuneration at 11% of net profit (computed under Section 198), and Schedule V puts further sub-limits on individual directors. Titan FY25’s ~₹4.56 crore director remuneration sits comfortably below those statutory ceilings, signalling that the promoter family is not extracting disproportionate cash via the salary line.
Second, the divergence between Revenue 10-year CAGR (~15%) and PAT 10-year CAGR (~29%) is the mathematical fingerprint of compressing employee-cost intensity. The arithmetic is simple: if total costs grew at the same rate as revenue, PAT would also compound at ~15%. The fact that PAT compounded almost 2× faster means non-revenue-linked costs — chief among them the wage bill — have been growing slower than the top line for a long time. That is what operating leverage looks like on a 10-year canvas.
Third, the combination of debt-light balance sheet (₹3 crore borrowings) and 103% CFO/OP ratio confirms that the cost discipline is real cash discipline. Companies that game employee cost via aggressive ESOP capitalisation, deferred bonus accruals, or unfunded gratuity liabilities show CFO trailing operating profit by a wide margin. Titan FY25’s 103% suggests every rupee of employee expense booked in the P&L is also leaving the building as cash — a sign of clean accounting.
How Retail Investors Should Actually Use This Metric
Here is the workflow a serious long-term investor follows when they open an Annual Report — under five minutes per company once you have done it a few times.
Step 1. Pull the consolidated Profit & Loss Statement. Locate the line “Employee Benefit Expense” or “Employee Benefits Expense” — it is mandatory under Schedule III, so it will always be there, named exactly like that.
Step 2. Pull “Revenue from Operations” from the same statement — not “Total Income” (which includes Other Income and would understate the ratio). Compute Employee Cost ÷ Revenue × 100.
Step 3. Repeat for the previous five years. Most listed companies publish a five-year financial summary in the front pages of the Annual Report; if not, use Screener.in or the BSE/NSE filings. Plot the five points. The shape matters: a declining ratio over five years on a growing revenue base is the operating-leverage signature; a rising ratio on flat revenue is a margin-compression flashing red.
Step 4. Benchmark against the sector. IT services at 60% is normal; FMCG at 60% would be a catastrophe. The benchmark map earlier in this article gives you the starting reference points.
Step 5. Cross-check with Note on Employee Benefits in the notes-to-accounts. Specifically read: (i) actuarial assumptions for gratuity (discount rate, salary inflation, attrition) — sudden changes here mask earnings; (ii) ESOP / share-based payments — heavy ESOP issuance suppresses cash employee cost but dilutes shareholders; (iii) related-party remuneration in the RPT note — confirms the director-remuneration portion of the total.
Step 6. Look at the Corporate Governance Report (mandatory under SEBI LODR Regulation 27 read with Schedule V) for the ratio of CEO compensation to median employee compensation — disclosure mandated by Section 197(12) of the Companies Act read with Rule 5 of Companies (Appointment and Remuneration of Managerial Personnel) Rules 2014. A ratio above 200:1 in a non-tech business is a governance amber light.
Common Traps and Misinterpretations
Even experienced investors make these mistakes when reading the employee-cost line.
Trap 1 — Comparing across sectors blindly. A 60% ratio at TCS is normal; the same ratio at a cement company would mean the business is dying. Always benchmark within sector.
Trap 2 — Ignoring capitalised employee cost. Software companies and project-execution companies sometimes capitalise a portion of employee cost into “Intangible Assets under Development” or “Software Development”. This deflates the reported P&L line without reducing actual cash going out. Always read the accounting-policies note for capitalisation thresholds.
Trap 3 — Ignoring ESOP / share-based payments. Under Ind AS 102, the fair value of equity-settled ESOPs is supposed to be charged to the P&L as employee cost over the vesting period — but the cash effect is zero, with the shareholder paying via dilution. A company with low employee-cost ratio but heavy annual ESOP issuance is shifting cost from the P&L to the share count. Always cross-check diluted EPS movement.
Trap 4 — Confusing total income with revenue from operations. Banks, NBFCs, holding companies, and capital-heavy businesses earn large Other Income (treasury, dividend, fair-value gains). Using Total Income as the denominator artificially deflates the employee-cost ratio. SEBI’s LODR mandates separate disclosure precisely to avoid this — use Revenue from Operations.
Trap 5 — Misreading a hiring-ahead-of-growth spike. A one or two-quarter spike in employee cost ahead of a capacity ramp-up (sales team build-out, plant commissioning) is a leading indicator of growth, not a problem. Look at CWIP, capex announcements, and management guidance to triangulate.
Trap 6 — Not adjusting for ex-gratia, severance and one-time payments. A retrenchment programme, a voluntary retirement scheme (VRS), or a one-time merger bonus will spike the ratio temporarily. Read the Schedule of Exceptional Items and the cash-flow statement’s adjustments to identify these.
Trap 7 — Forgetting actuarial assumption changes. Gratuity is an actuarially valued defined-benefit liability. A change in discount rate of just 50 basis points can swing the gratuity expense by 5%–10%. Always check whether actuarial assumptions changed year-on-year before drawing trend conclusions.
The Indian Regulatory Architecture Around Employee Cost
For Indian listed companies, the employee-cost line sits at the intersection of an unusually dense regulatory web. Understanding the architecture deepens your ability to read the disclosure.
Companies Act 2013, Section 197 caps total managerial remuneration of all directors at 11% of net profit (computed per Section 198). Within that, individual managing/whole-time directors are limited to 5% each (10% if more than one) without shareholder approval; non-executive director sitting fees are capped at ₹1 lakh per meeting under Rule 4 of Companies (Appointment and Remuneration) Rules 2014.
Section 197(12) read with Rule 5 mandates disclosure of: the ratio of each director’s remuneration to median employee remuneration; percentage increase in remuneration of each director, CFO, CEO, company secretary and manager during the year; percentage increase in median employee remuneration; number of permanent employees; and explanation of any extraordinary disparity.
SEBI LODR Regulation 17 and 19 require an independent Nomination and Remuneration Committee (NRC) to recommend all director and KMP remuneration, with majority-independent membership and at least one independent director as chair. The NRC’s policy must be disclosed in the Annual Report.
The Code on Wages 2019 (notified, awaiting full operationalisation) consolidates the Payment of Wages Act 1936, Minimum Wages Act 1948, Payment of Bonus Act 1965 and Equal Remuneration Act 1976. Once fully operational at state level, it will harmonise the wage base across the country and reshape the lower end of the wage bill for most labour-intensive listed companies.
Ind AS 19 mandates separate disclosure of short-term, post-employment (gratuity, pension, PF), other long-term, and termination benefits, with actuarial reconciliation tables for defined-benefit obligations. Ind AS 102 handles share-based payments. Together they ensure the employee-cost line is one of the most disclosed line items in any Annual Report.
The retail investor who reads these notes is, quite literally, getting a richer view of the business than the trader who only sees daily candles.
Five-Year Self-Test: Score Your Own Portfolio
Pull the last five Annual Reports of every stock you own. For each, compute the Employee Cost-to-Revenue ratio for FY21, FY22, FY23, FY24 and FY25. Score each stock as follows:
- Score +1: Ratio compressed over 5 years on a growing revenue base — sign of operating leverage.
- Score 0: Ratio roughly flat on growing revenue — stable cost discipline, neutral.
- Score –1: Ratio expanded on flat or declining revenue — margin-compression flag.
- Score –2: Ratio expanded materially on flat revenue, AND CEO-to-median pay ratio rose — governance concern.
Add up your portfolio score. A portfolio with a positive aggregate score has, by construction, structural operating leverage embedded. A portfolio with a negative aggregate score is fighting a margin-compression headwind every quarter. This single five-minute exercise will tell you more about the quality of your portfolio than a year of CNBC.
Key Takeaways
- The Employee Cost-to-Revenue ratio is the cleanest fixed-cost intensity metric on the P&L — it sits as a mandatory standalone line under Schedule III and Ind AS 19, making it harder to game than any other operating-cost figure.
- Operating leverage is the gap between revenue growth and employee-cost growth. When revenue compounds faster than headcount cost over a sustained period, EBITDA margins structurally expand and PAT compounds at 1.5×–2× the revenue CAGR.
- Titan Biotech FY25 illustrates the disciplined pattern with verifiable audited markers: ~₹214 crore revenue, ~₹4.56 crore director remuneration (~2.13% of revenue — well inside Section 197 ceilings), ~18–22% EBITDA margin range, 103% CFO/OP ratio, and a 10-year PAT CAGR (~29%) running nearly double the Revenue CAGR (~15%) — the mathematical signature of wage-bill operating leverage on a 10-year canvas.
- For retail investors, the metric must always be benchmarked within sector, traced over five years, cross-checked with revenue-per-employee, and read alongside the ESOP, gratuity actuarial-assumption and capitalisation notes. The number in isolation is meaningless; in context, it is one of the most powerful quality screens you can run in under five minutes.
SEBI Disclaimer
Disclaimer: This article is for educational and informational purposes only. It is not investment advice, and not a buy, sell, or hold recommendation on any stock mentioned, including Titan Biotech Limited. Equity markets carry risk; please do your own research or consult a qualified professional before making investment decisions.
