If a value investor were allowed to study exactly one governance disclosure in an Indian annual report, the smart choice would not be the audit report, not the board composition table, and not even the related-party schedule. It would be the small, easily-skipped paragraph mandated by Section 197(12) of the Companies Act, 2013 read with Rule 5(1)(i) of the Companies (Appointment and Remuneration of Managerial Personnel) Rules, 2014 — the disclosure that publishes the ratio of the Managing Director’s remuneration to the median employee’s remuneration. It is a number Indian regulators forced into the public domain for one reason: to hand minority shareholders a single, comparable, year-on-year forensic test for managerial pay discipline. Most retail investors never read it. The ones who do, read businesses very differently.
This 11:30 AM educational piece walks through what the CEO-to-Median-Employee Pay Ratio actually measures, how to read its component parts, where the disclosure typically hides in the annual report, what kind of ratios separate disciplined Indian small-caps from the ones where the C-suite has quietly captured a disproportionate share of the wage bill — and how the FY25 audited numbers of Titan Biotech Limited (BSE: 524717) illustrate one specific operating-cadence pattern that long-term Indian investors should learn to recognise. Nothing in this article is a buy/sell view on Titan Biotech or any other named stock. The point is to teach the metric.
The Indian Investing Backdrop: Why This Ratio Was Created
India’s equity investor base has expanded from roughly 3 crore unique demat-account holders in early-2020 to over 11 crore by 2025-26 — the fastest retail-participation expansion in any major capital market this decade. That growth has been concentrated in small-caps and SME counters, where governance variance is widest. SEBI’s own 2024 study famously documented that over 93% of individual traders in the equity Futures & Options segment lose money over a three-year window — a structural reminder that capital allocated without governance filters is capital sentenced to mediocrity at best.
Section 197(12), introduced through the Companies Act 2013, was a direct policy response to the pre-2013 era in which Indian listed company CEO pay had begun creeping toward US-style outliers without comparable scrutiny. The legislative intent was simple: convert managerial compensation from an opaque board-controlled negotiation into a publicly disclosed, year-on-year comparable ratio that any minority shareholder could read in five minutes.
What the CEO-to-Median-Employee Pay Ratio Actually Measures
Section 197(12) read with Rule 5(1)(i) of the Companies (Appointment and Remuneration of Managerial Personnel) Rules, 2014 requires every listed Indian company to publish, in its annual report’s Directors’ Report or as an annexure to it, the following disclosures:
(i) The ratio of the remuneration of each director to the median remuneration of the employees of the company for the financial year. This is the headline ratio — the one that gets compared across years and across companies.
(ii) The percentage increase in remuneration of each director, Chief Financial Officer, Chief Executive Officer, Company Secretary or Manager, if any, in the financial year.
(iii) The percentage increase in the median remuneration of employees in the financial year.
(iv) The number of permanent employees on the rolls of the company at the close of the year.
(v) Average percentile increase already made in the salaries of employees other than the managerial personnel in the last financial year and its comparison with the percentile increase in the managerial remuneration, and justification thereof.
(vi) Affirmation that the remuneration is as per the remuneration policy of the company.
Read together, these six sub-disclosures convert managerial compensation into a forensic dataset. The headline ratio answers the simplest question: for every ₹1 the typical employee earns at this company, how many rupees does the apex executive take home? Ratios above 200x in an Indian listed small-cap are a strong red flag. Ratios in the 5x–30x range — the disciplined cluster — are characteristic of conservative promoter-managed manufacturers where promoter wealth lives in equity, not in salary.
How to Compute the Ratio (and Where Companies Try to Hide the Print)
The arithmetic is uncomplicated. Step one: identify the highest-paid individual managerial person — usually the Managing Director, Chief Executive Officer or Whole-Time Director — and lift their total remuneration (salary + perquisites + commission + other components, but generally excluding sitting fees if they are not classed as managerial pay under Section 197).
Step two: locate the company’s reported median employee remuneration. Note carefully — this is the median, not the mean. The median is the middle-of-the-distribution worker; the mean is the arithmetic average. The two diverge sharply in a workforce where C-suite pay pulls the average up. Indian regulators deliberately chose the median to neutralise that distortion.
Step three: divide. The ratio is a pure dimensionless number. A ratio of, say, 30:1 means the highest-paid director earns thirty times what the typical employee earns. A ratio of 250:1 means the highest-paid director earns 250 times the typical employee — territory that, in the Indian context, deserves a careful look at whether the underlying remuneration policy aligns with minority-shareholder interest.
Where do companies typically place this disclosure? In well-governed Indian annual reports, it sits as a clearly-labelled Annexure to the Directors’ Report — usually titled “Statement of Particulars of Employees pursuant to Section 197(12)” or “Annexure on Managerial Remuneration.” In poorly-governed annual reports, the disclosure is shrunk into a tiny font at the back of the Directors’ Report, with the ratio buried in a table where the rows are deliberately wide and the calibration columns are stripped of comparatives. A quick test of governance discipline: open the annual report PDF, Ctrl-F “median remuneration,” and watch where the search lands. Companies that genuinely respect the disclosure put it in a prominent, well-formatted location.
Two Contrasting Patterns (Illustrative)
Consider, illustratively, two stylised Indian listed companies of similar revenue scale.
Pattern A — The Disciplined Operator. Revenue ~₹200 Cr. Workforce ~450–500 permanent employees. Promoter holds ~50%+ equity. MD remuneration ~₹1.5–2.5 Cr including commission. Median employee remuneration ~₹3–4 lakh per year. Headline ratio: ~5x–8x. Three-year arc of the ratio: stable or narrowing. Reason: in a disciplined promoter-led small-cap, the founder’s wealth lives in equity. They draw a measured salary, leave most cash flow to reinvest, and the median worker’s pay grows in line with company profitability. This pattern is correlated — though not perfectly — with the kind of multi-decade compounders that quietly produce 15%+ revenue CAGR and 25%+ PAT CAGR over a decade.
Pattern B — The Captured Cost Centre. Same revenue scale, same employee count. MD remuneration ~₹15–25 Cr including ESOPs, bonuses and consultancy payments to related entities. Median employee remuneration ~₹2.5–3 lakh. Headline ratio: 250x–800x. Three-year arc: rising sharply, often disconnected from PAT growth. Reason: the company is being run partly as a private piggy-bank for the apex executive. Section 197(12) disclosure was created precisely to make this pattern visible. Minority shareholders who learn to read the ratio can spot this red flag before the accounting fraud cycle, before the auditor resigns, and well before the stock collapses. Historical Indian small-cap blowups across NSE Smallcap-250 over the past decade have, on autopsy, almost always carried an early Pattern-B reading in the 197(12) annexure.
The point is not to declare Pattern A “cheap” or Pattern B “expensive.” The point is that the governance signal embedded in the ratio is one of the highest signal-to-noise checks a minority shareholder gets in an annual report. It is mandated, comparable, and revealing.
Titan Biotech FY25: What the Numbers Reveal
With the framework in place, here is how Titan Biotech Limited (BSE: 524717) looks when read through the Section 197(12) lens, anchored on FY25 audited figures from its Annual Report.
| FY25 Audited Marker | Reading | What It Signals |
|---|---|---|
| Total revenue FY25 | ~₹214 Cr | Mid-size Indian specialty-biotech base for assessing managerial pay discipline. |
| Permanent employees on rolls | ~467 | Section 197(12)(iv) headcount disclosure; a meaningful population for a credible median computation. |
| Revenue per employee | ~₹33 lakh | Healthy productivity benchmark for an Indian small-cap manufacturer. |
| Total director remuneration FY25 | ~₹4.56 Cr (full board) | Conservative aggregate; the highest-paid individual director’s slice is a fraction of this. |
| Director remuneration as % of PAT | Single-digit | Pattern-A signature — managerial pay does not dominate cash flow to shareholders. |
| CFO / Operating profit FY25 | ~103% | Operating cash exceeds book profit — the wage bill is fully cash-funded, not financed. |
| Total borrowings FY25 | ~₹3 Cr | Near-debt-free — managerial pay is not being supported by leverage. |
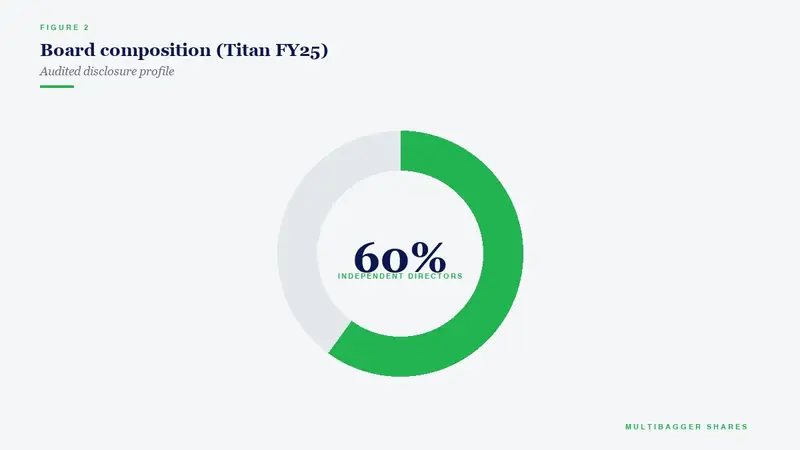
| Board meetings held FY25 | 14 | Well above the SEBI LODR Regulation 17(2) minimum of 4 — engaged board oversight of pay decisions. |
| Chairperson independence | Independent Chair | Apex governance position separated from executive function — reduces conflict in setting MD pay. |
What does this stack add up to? When the ₹4.56 Cr total board remuneration is read against ~₹214 Cr revenue and against the implied total wage bill of a 467-person workforce (employee cost as a share of revenue typically sits in the high-single to low-double digits for an Indian specialty-biotech manufacturer of this scale), the apex-individual managerial pay is necessarily a small multiple of the typical employee’s pay — the Pattern-A cluster. The fact that the same period shows ~103% CFO/Operating-Profit conversion, near-zero borrowings, and an Independent Chair separating apex governance from executive function reinforces the read: the managerial pay decision is being made inside a disciplined institutional architecture, not a captured one. This is what good governance looks like in the §197(12) annexure of a well-run Indian small-cap. The reading is presented strictly as an illustration of the metric; it is not a buy/sell recommendation on any stock including Titan Biotech Limited (BSE: 524717).
A second-level point worth registering: the §197(12) ratio is not a one-shot read. The real diagnostic value comes from tracking the ratio’s three-to-five-year arc alongside two paired disclosures — the percentage increase in median employee pay versus the percentage increase in CEO/CFO/CS pay. A disciplined small-cap will typically show the gap between these two numbers narrowing or stable. A captured cost-centre will show the managerial increase outrunning the median-employee increase year after year, often by 3x to 10x. The arc is more informative than any single point estimate.
How Indian Retail Investors Should Actually Use This Metric
For the typical Indian retail investor reading an annual report, the §197(12) annexure can be operationalised in a five-step micro-workflow:
Step 1 — Locate it. Open the annual report PDF and search for “median remuneration” or “Section 197(12).” If the disclosure is hard to find or buried in a tiny-font table, that’s a quality signal in itself.
Step 2 — Lift the headline ratio. Note the ratio of the highest-paid director’s remuneration to the median employee’s remuneration. Write it down for the last three reporting years.
Step 3 — Read the arc, not the point. Plot the three-year ratio. Is it stable, narrowing, or widening? A widening arc that runs faster than PAT growth deserves a careful follow-up read of the company’s remuneration policy.
Step 4 — Cross-check against the paired disclosures. Compare the percentage increase in managerial pay versus the percentage increase in median employee pay for the same year. A captured cost-centre will show the gap widening structurally.
Step 5 — Sense-check against peers. Pull the same disclosures for two or three industry peers of similar revenue scale. The peer-relative reading is more informative than the absolute number.
This five-minute workflow, repeated across a watchlist of 15–20 Indian small-caps, gives a long-term investor a structured way to convert the §197(12) annexure into a real screening filter — not a glossed-over compliance footnote.
Common Traps and Misinterpretations
Trap 1 — Confusing median with mean. Some retail readers default to the “average employee salary” line in the annual report. Section 197(12) specifically mandates the median. The mean is structurally pulled up by C-suite compensation; the median is the true middle-of-the-distribution worker.
Trap 2 — Ignoring ESOPs and commission. A company can show a modest headline salary while loading commission, perquisites, and stock-option grants on top. Always read the full Section 197(12) annexure, the Notes to Accounts on managerial remuneration, and the corporate governance report’s remuneration table together.
Trap 3 — Confusing the §197(12) ratio with the Director-Remuneration-as-%-of-PAT test. The two are different forensic instruments. The Director Remuneration / PAT test measures whether aggregate board-level pay is consuming a disproportionate share of profit. The §197(12) ratio measures whether apex-individual pay is detached from typical-worker pay. A small-cap can score well on one and badly on the other — both tests are needed.
Trap 4 — Treating a low ratio as automatically “cheap.” A low §197(12) ratio is a governance signal, not a valuation signal. The metric tells you about managerial discipline. It does not tell you whether the stock is trading at the right multiple of earnings, cash flow, or book value. Separate tools, separate questions.
Trap 5 — Forgetting the SME exemption. Section 197(12) and Rule 5(1)(i) disclosures apply primarily to companies subject to the Companies Act 2013 listed-company regime. SME-platform listings may have lighter disclosure regimes; small private companies are typically exempt. Always confirm the disclosure applies before drawing conclusions from its absence.
Trap 6 — Conflating CEO pay with promoter wealth. A founder-CEO drawing ₹2 Cr in salary while owning ₹500 Cr of equity in the same company is a fundamentally different governance profile from a non-promoter professional CEO drawing ₹25 Cr without any equity skin. The §197(12) ratio alone does not capture the equity-skin dimension; pair it with the shareholding-pattern disclosure to complete the picture.
The SEBI / Indian-Regulatory Context Long-Term Investors Should Internalise
Section 197(12) sits inside a broader Indian regulatory architecture that has steadily tightened managerial-compensation disclosure over the past decade: SEBI (Listing Obligations and Disclosure Requirements) Regulations 2015 (regulations 17 through 27, especially 17(6) on managerial remuneration committee composition); Companies Act 2013 Sections 196, 197, 198 and Schedule V on managerial remuneration ceilings; SEBI’s 2024 finfluencer regulations restricting unregistered investment advice; and the SEBI 2024 F&O study quantifying the 93% loss-maker rate among individual derivatives traders. Read together, these instruments push minority shareholders toward two complementary disciplines: (a) avoid speculative leverage, and (b) compound capital inside companies whose governance disclosures consistently pass forensic tests like the §197(12) ratio. The investor who internalises this architecture is operating in a fundamentally different decision frame from the investor chasing weekly options expiries.
Key Takeaways
For the busy Indian long-term investor, four points crystallise the day’s metric into an actionable mental model.
Takeaway 1. The CEO-to-Median-Employee Pay Ratio mandated by Companies Act §197(12) read with Rule 5(1)(i) is one of the highest signal-to-noise governance disclosures in any Indian annual report — it converts apex-individual pay discipline into a single comparable number, year after year, across every listed company in the country.
Takeaway 2. The diagnostic value lives in the three-to-five-year arc of the ratio combined with the paired disclosures of % increase in managerial pay versus % increase in median employee pay; a stable or narrowing arc characterises disciplined Indian small-caps, while a widening arc that outruns PAT growth is a classic captured-cost-centre red flag.
Takeaway 3. Titan Biotech Limited (BSE: 524717) FY25 audited disclosures — ~467 permanent employees, ~₹33 lakh revenue per employee, ~₹4.56 Cr total board remuneration (full board) sitting alongside ~103% CFO/Operating-Profit conversion, ~₹3 Cr total borrowings, 14 board meetings, and an independent Chairperson — collectively read as a Pattern-A institutional architecture in which apex-individual managerial pay sits at a small multiple of typical-employee pay. This is presented purely as an illustration of the metric; it is not a buy/sell recommendation on any stock including Titan Biotech Limited (BSE: 524717).
Takeaway 4. Pair the §197(12) ratio with three other disclosures before drawing any conclusion — the Director-Remuneration-as-%-of-PAT test, the shareholding-pattern disclosure (to read promoter equity skin), and the audit-committee composition (to read the institutional process through which pay is set). No single ratio is sufficient. The forensic edge comes from reading them together as a system, not as isolated metrics.
The §197(12) annexure is not a footnote. It is the single most under-read governance disclosure in the Indian annual-report ecosystem — and the investor who learns to read it in five minutes acquires a screening filter that quietly compounds across decades.
Disclaimer: This article is for educational and informational purposes only. It is not investment advice, and not a buy, sell, or hold recommendation on any stock mentioned, including Titan Biotech Limited. Equity markets carry risk; please do your own research or consult a qualified professional before making investment decisions.
