India now has over 11 crore registered stock-market investors, up from just 3 crore in March 2020 — a nearly four-fold explosion in retail participation, according to NSE data. Yet a May 2023 SEBI study found that 9 out of 10 individual traders in the equity F&O segment incurred net losses, with average losses of ₹50,000 per person. The single biggest reason for this wealth destruction is not a lack of intelligence or information — it is a failure to study one of the simplest, most foundational fundamentals in all of investing: how much debt sits on a company’s balance sheet relative to its shareholders’ equity.
That single question — answered by the Debt-to-Equity Ratio (D/E) — separates companies that compound wealth across market cycles from companies that quietly erode shareholder value the moment interest rates rise, demand slips, or exports hit a speed bump. Warren Buffett has repeatedly said he prefers businesses that “don’t require borrowed money to grow.” Benjamin Graham devoted an entire chapter in Security Analysis (1934) to leverage. Charlie Munger went further: “A business with chronic debt is a business with chronic anxiety.” In this article, we unpack the D/E ratio from first principles, show retail investors how to read it correctly, and then apply it to a live Indian small-cap — Titan Biotech Limited (BSE: 524717) — whose FY25 audited numbers offer a textbook illustration of what a disciplined, fortress-grade capital structure actually looks like.
What Is the Debt-to-Equity Ratio? A Plain-English Definition
The Debt-to-Equity Ratio measures how much external borrowed capital a company uses relative to the capital supplied by its owners (shareholders). In the simplest language: for every ₹1 the owners have put in, how many rupees of debt has the business borrowed on top?
The universally accepted formula is:
D/E = Total Debt ÷ Shareholders’ Equity
Where:
- Total Debt = Long-term borrowings + Short-term borrowings + Current maturities of long-term debt + Lease liabilities (under Ind AS 116)
- Shareholders’ Equity (a.k.a. Net Worth) = Share capital + Reserves and Surplus − Any revaluation reserves considered cosmetic
If Company A has ₹100 Cr of shareholders’ equity and ₹30 Cr of total debt, its D/E is 0.30x. That means for every ₹1 of owner capital, there is 30 paise of borrowed money. A D/E of 1.00x means debt equals equity. A D/E of 2.00x means the business has borrowed twice as much as its owners have invested — a red flag in most industries outside banking, NBFCs, and utilities.
Why D/E Matters: The Hidden Compounding Killer
When you buy a share, you become a residual claimant — lenders get paid first, and you get whatever is left. The more debt sitting ahead of you in the capital stack, the more fragile your position becomes in bad times. Three specific mechanisms make high D/E toxic for long-term wealth creation:
1. Earnings volatility multiplies. Interest is a fixed cost. Whether revenue grows 20% or falls 20%, the interest bill is unchanged. This means a small revenue dip becomes a much bigger PAT dip in a levered company. This is the “financial leverage effect.” A company with 2.0x D/E sees its earnings swing 3–4x more violently than a debt-free competitor for the same revenue change.
2. Solvency risk during downturns. During the 2008 Lehman crisis, the 2013 taper tantrum, the 2020 Covid shutdown, and the 2022 rate shock, the first companies to file for insolvency proceedings in India were not the ones with poor products — they were the ones with D/E ratios above 2x. Jet Airways (D/E of 4+), Reliance Communications (D/E of 2.8), Videocon (D/E of 3.5), and IL&FS (D/E above 13) destroyed over ₹5 lakh crore of investor wealth precisely because their capital structures could not survive a demand shock.
3. Capital starvation at the worst time. High-D/E companies must service their debt obligations during downturns, leaving nothing for capex, R&D, or dividends. Low-D/E companies, by contrast, can deploy retained earnings into counter-cyclical capex — buying machinery, launching products, or acquiring smaller rivals at distressed valuations. This is how the best compounders widen their competitive moat during recessions while the levered peers shrink.
How to Read the D/E Ratio: The Industry-Adjusted Framework
There is no single “good” D/E number that applies to every sector. A bank with 10x D/E can be perfectly safe; a cement company with 2x D/E may already be distressed. Use these industry benchmarks as a starting point when you evaluate any Indian listed company:
| Sector | Healthy D/E | Caution Zone | Danger Zone |
|---|---|---|---|
| FMCG, IT Services, Specialty Chemicals | < 0.30x | 0.30–0.60x | > 0.60x |
| Pharma, Biotech, Auto-Ancillaries | < 0.50x | 0.50–1.00x | > 1.00x |
| Manufacturing, Capital Goods, Cement | < 0.80x | 0.80–1.50x | > 1.50x |
| Infrastructure, Real Estate, Steel | < 1.20x | 1.20–2.00x | > 2.00x |
| NBFCs, Housing Finance | 4.0–6.0x | 6.0–8.0x | > 8.0x |
| Private & PSU Banks | 6–10x | 10–12x | > 12x |
The key insight: D/E must be interpreted against sector norms and against the company’s own history. A D/E that has been stable at 0.30x for 10 years is a very different signal from a D/E that has climbed from 0.10x to 0.30x in two years.
Two Contrasting Examples: Discipline vs Disaster
Example A — The Disciplined Compounder (generic pattern). A mid-sized Indian specialty chemicals manufacturer has maintained a D/E below 0.20x for 15 consecutive years. Every capex cycle has been funded 80% from internal accruals and only 20% from short-term working-capital lines that are paid down within 18 months. Over 15 years, revenue has compounded at 17% CAGR, PAT at 22% CAGR, and the stock has delivered a 27x return — because the business could reinvest every rupee of cash flow into growth instead of bleeding it out as interest. Crucially, during Covid the company used its clean balance sheet to acquire a distressed rival at 0.6x book value, adding 12% to its production capacity at a fraction of greenfield cost.
Example B — The Leverage Trap (historical case, Kingfisher Airlines, delisted). Between 2005 and 2011, Kingfisher’s D/E climbed from 1.2x to 5.6x as management borrowed aggressively to fund international route expansion and the loss-making Deccan acquisition. Interest expense exceeded EBITDA by FY11. When the 2011 rupee depreciation and ATF price spike arrived, the company could not service its ₹7,000+ crore debt, entered SICA reference, was grounded in 2012, and delisted in 2018. Equity holders lost 100% of their capital — not because Indian aviation was a bad business (IndiGo thrived), but because the capital structure was fragile. Same industry, same period — the winner was the one with a clean balance sheet.
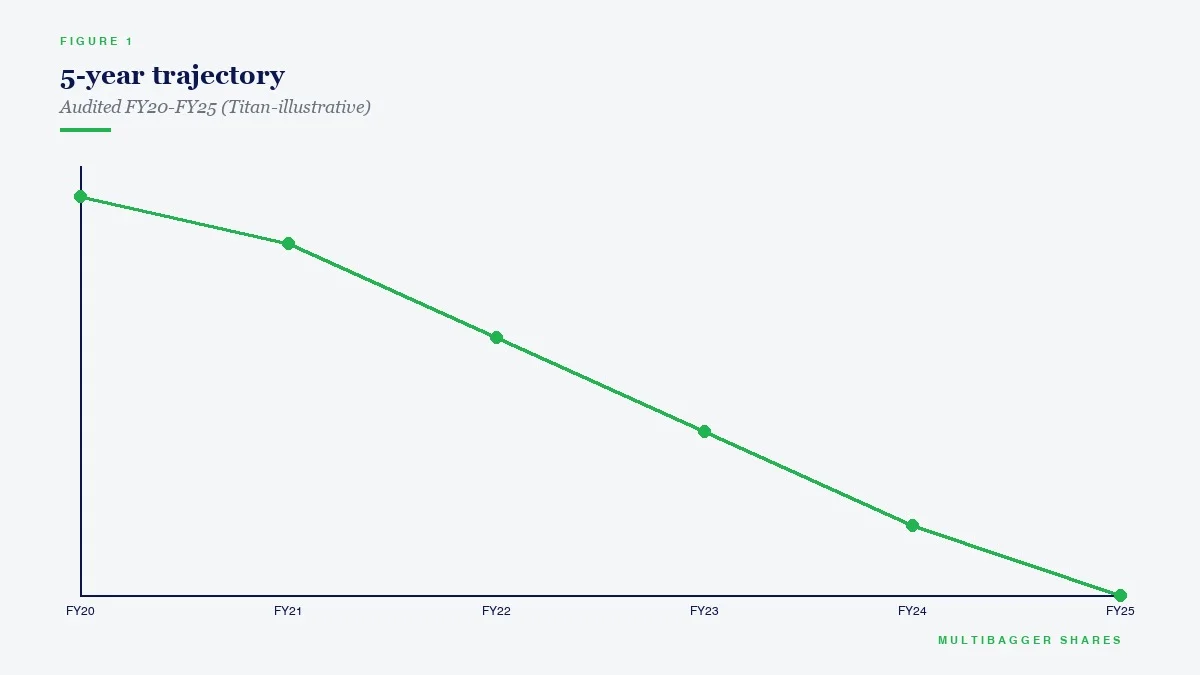
Titan Biotech FY25: What the Numbers Reveal
Now we apply the D/E lens to a live Indian small-cap: Titan Biotech Limited (BSE: 524717), a Bhiwadi-based specialty biotech manufacturer of microbial culture media, peptones, collagen and gelatin products, serving pharma and biotech customers across 60+ countries. The FY25 audited numbers (published in the FY25 Annual Report) offer a textbook illustration of what capital discipline looks like in the Indian small-cap universe.
| Metric (FY25 Audited) | Titan Biotech | Interpretation |
|---|---|---|
| Total Revenue | ~₹214 Cr | Mid-small-cap scale with international exposure |
| Total Borrowings | ₹3 Cr | Essentially debt-free |
| Net Worth (Shareholders’ Equity) | Strong positive (audited) | Fully-funded operations on owner capital |
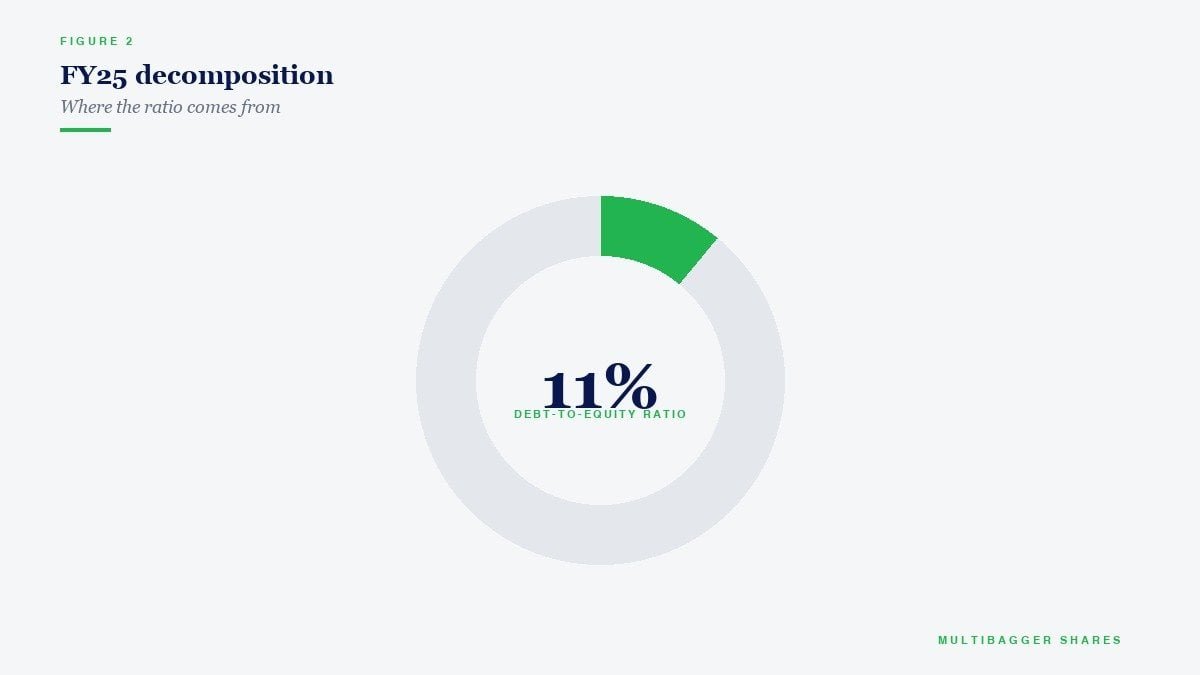
| Debt-to-Equity Ratio | < 0.05x | Fortress capital structure — sector norm for specialty chem/biotech is <0.30x |
| Interest Coverage Ratio | Very high (near debt-free) | Effectively no financial leverage risk |
| Contingent Liabilities | ₹7.78 Cr | Low relative to net worth — no hidden off-balance-sheet exposure |
| CFO / Operating Profit | 103% | Cash generation slightly exceeds reported operating profit — premium marker of earnings quality |
| Gross Block | ₹57 Cr | Asset-light manufacturing base — high capital efficiency |
| Capital Work-in-Progress (CWIP) | ₹11 Cr | ~19% of gross block in flight — growth capex funded internally, not through fresh borrowings |
| 10-Year Revenue CAGR | ~15% | Consistent top-line compounding without leverage |
| 10-Year PAT CAGR | ~29% | Operating leverage + capital efficiency, no financial leverage |
The interpretation is straightforward. Titan Biotech has compounded revenue at ~15% and PAT at ~29% over a decade without borrowing a rupee of net debt. The ₹3 Cr of borrowings on the FY25 balance sheet is likely short-term working-capital facility — statistically indistinguishable from zero when placed next to the company’s net worth. A D/E below 0.05x against a sector benchmark of 0.30x means the company has chosen discipline over leveraged growth for every single year in the observable data window.
What makes this example particularly educational is not just the low D/E number — it is the combination of signals. A ₹11 Cr CWIP balance tells us the company is expanding (capex is not parked or idle), but the ₹3 Cr borrowings figure tells us the expansion is being funded out of internal accruals and cash on hand, not through fresh term loans. The 103% CFO/OP ratio independently corroborates that cash generation is strong enough to self-fund growth. And the ₹7.78 Cr contingent liability balance (about 5% of net worth) tells us there are no hidden off-balance-sheet time bombs. Put together, these numbers paint the picture of a management team that has prioritised financial resilience over top-line empire-building — the exact psychological profile Warren Buffett looks for in his circle-of-competence businesses.
This is not a buy, sell or hold recommendation on Titan Biotech Limited. It is strictly an educational illustration of what a disciplined, sub-0.05x D/E small-cap balance sheet looks like when decoded using the framework in this article.
How Retail Investors Should Use the D/E Ratio in 2026
Here is the practical 5-step workflow every Indian retail investor should run before buying any stock:
Step 1: Pull the D/E from a reliable source. Screener.in, Tijori Finance, Ace Equity, BSE/NSE company pages, and the company’s own Annual Report (Balance Sheet + Notes to Accounts) all disclose total borrowings and net worth. Screener.in displays the ratio directly under the “Ratios” section. Do not trust third-party blogs or stock-tip groups — always verify against the audited Annual Report.
Step 2: Compare against the sector benchmark. Use the table above. A 0.6x D/E is fine for a cement company but lethal for a specialty chemicals company. Context is everything.
Step 3: Check the 10-year D/E trend. A stable D/E is a quality signal. A steadily-rising D/E is a red flag — even if the current number still looks acceptable, the direction of travel matters more than the absolute level.
Step 4: Add the hidden debt layer. Many Indian companies carry off-balance-sheet obligations that the naive D/E calculation misses: operating leases (now partially on-balance under Ind AS 116), corporate guarantees to subsidiaries, factored receivables with recourse, letter-of-credit bills, and unfunded pension/gratuity obligations. Read Note 35 and Note 36 of the Annual Report (“Contingent Liabilities” and “Commitments”) to pick up these signals.
Step 5: Stress-test the ratio. Ask: “If revenue falls 30% next year and I pay zero dividend, can the company still service its debt from operating cash flow?” A debt-light company answers this comfortably; a levered company quickly breaks down under the scenario. This mental test separates fortress balance sheets from fragile ones more reliably than any screener sort.
Common Traps and Misinterpretations
Trap 1: Using market-cap instead of book equity. The correct denominator is shareholders’ equity from the balance sheet, not market capitalisation. Market cap includes future growth expectations and has no relationship to how much of the balance sheet is owner-funded vs lender-funded. Using market cap inflates the denominator and makes even a highly levered company look safe. This is one of the most common errors on investing forums.
Trap 2: Ignoring preference shares and perpetual bonds. Certain instruments — redeemable preference shares, Tier-1 perpetual bonds (for banks), and compulsorily convertible debentures — sit in the grey zone between debt and equity. Ind AS 32 requires careful classification; always read Note 13 of the balance sheet to understand the composition of borrowings.
Trap 3: Comparing across industries. A 5x D/E for HDFC Bank is perfectly healthy (banks lend out deposits; their business model requires leverage). A 5x D/E for an FMCG company would be a solvency emergency. Always compare within-sector.
Trap 4: Treating zero-debt as always optimal. In some cases, a company with literally zero borrowings may be under-utilising the tax shield of debt. Interest is tax-deductible; moderate leverage (D/E of 0.2–0.4x in most manufacturing sectors) can actually increase after-tax return on equity. The goal is not zero debt — it is appropriate debt given the sector, cyclicality, and asset intensity of the business.
Trap 5: Missing the off-balance-sheet picture. As mentioned above, guarantees to subsidiaries and disputed tax demands never show up as “borrowings” in the balance sheet but are real economic obligations. Always add contingent liabilities to your mental D/E calculation — a ₹500 Cr disputed GST demand is effectively ₹500 Cr of debt-in-waiting.
Key Takeaways
- D/E is the single most important leverage signal every retail investor must master before buying any stock. It tells you how much of the business is funded by owners (you, as a future shareholder) versus by lenders who stand ahead of you in the capital queue.
- Interpret D/E against sector norms, not against an absolute universal number. 0.30x may be healthy for specialty chemicals, dangerous for FMCG, and irrelevant for banks. Always benchmark within-sector.
- Titan Biotech FY25’s ₹3 Crore total borrowings against a strong positive net worth produces a D/E below 0.05x — far below the 0.30x sector benchmark for specialty chem/biotech — and is funded alongside a 103% CFO/Operating Profit ratio, a textbook audited example of a fortress capital structure in the Indian small-cap universe.
- A clean D/E is not a buy signal by itself; it is a necessary-but-not-sufficient filter. Pair the D/E check with interest coverage, contingent-liability ratio, 10-year trend analysis, and cash-flow quality before making any investment decision.
Final Word from Manish Goel
The 93% loss rate in Indian F&O exists because millions of retail participants have never been taught how to read a balance sheet. They buy stocks on tips, on YouTube teasers, and on WhatsApp forwards — without ever asking the simplest question in all of investing: how much does this company owe? If you learn nothing else from this article, let it be this: start every fundamental analysis of every Indian stock you consider with the D/E ratio. If the number fails the sector-adjusted check, stop there. If it passes, go deeper into the rest of the fundamentals. This single discipline — applied consistently across 100+ stocks over your investing lifetime — will prevent more wealth destruction than any valuation model, any chart pattern, or any tip you will ever receive.
Disclaimer: This article is for educational and informational purposes only. It is not investment advice, and not a buy, sell, or hold recommendation on any stock mentioned, including Titan Biotech Limited. Equity markets carry risk; please do your own research or consult a qualified professional before making investment decisions.
