The number of registered investors on the National Stock Exchange has multiplied from roughly 3 crore in 2020 to more than 11 crore by early 2026 — a once-in-a-generation broadening of equity ownership in India. Yet the same SEBI study that documented this expansion also reported that nine out of ten individual traders in the equity Futures & Options segment incurred net losses, with aggregate losses crossing ₹1.81 lakh crore in a single year. The gap between participation and durable wealth creation is widening, and the single most common reason is that retail investors keep reaching for the P/E ratio as if it were a thermometer for “cheap” or “expensive”.
The P/E ratio is useful, but it breaks in three very common situations: (1) when reported earnings are temporarily depressed by capex, (2) when capital structure differs dramatically across comparables, and (3) when a company has a meaningful net-cash position that distorts the equity-only denominator. In all three cases, professionals reach for a different lens — one that is capital-structure-neutral and harder for accounting noise to manipulate. That lens is the Enterprise Value to Sales ratio (EV/Sales), and today we are going to learn how to read it like a forensic analyst, using Titan Biotech Limited’s (BSE: 524717) FY25 audited financials as our educational illustration of what a clean, near-debt-free, cash-generative balance sheet actually looks like through this lens.
What Exactly Is EV/Sales?
Enterprise Value to Sales is the ratio of a company’s total enterprise value — what an acquirer would pay to buy the whole business, including its debt, and net of its cash — divided by its trailing twelve-month revenue. Where the P/E ratio asks “how many years of earnings am I paying for the equity?”, EV/Sales asks the more fundamental question: “how many years of sales am I paying for the entire operating business?”
Mathematically:
EV/Sales = (Market Capitalisation + Total Debt − Cash & Equivalents) ÷ Trailing 12-Month Revenue
The numerator is the cost to the buyer of acquiring the whole capital structure: every equity share at the prevailing market price, every rupee of borrowed money the buyer would inherit, less every rupee of liquid cash the buyer would walk away with. The denominator is what the business produced as top-line revenue over the past four quarters. The output, a multiple, tells you how many rupees of enterprise value the market is currently assigning to each rupee of annual sales.
Why Capital-Structure Neutrality Matters in the Indian Context
In the Indian markets, capital structures vary enormously even within the same sector. A specialty chemicals company with zero borrowings and ₹500 crore of treasury cash will look optically “expensive” on P/E next to a leveraged peer carrying ₹2,000 crore of debt, because the leveraged peer’s equity base is smaller and its EPS is being amplified by financial leverage. EV/Sales removes the distortion. By putting both equity holders and debt holders on the numerator and netting out the cash buffer, it lets you compare a debt-free compounder with a leveraged turnaround story on apples-to-apples terms.
This is why fund managers and corporate-acquisition desks across India lean on EV-based multiples for any transaction analysis. A buyer of the business does not get to pretend the debt isn’t there. SEBI’s takeover code (SAST Regulations 2011) and the Companies Act’s Section 232 scheme-of-arrangement requirements both implicitly anchor consideration to enterprise value, not equity value. If the professional market uses EV-based multiples for the most expensive decisions in the economy, retail investors should learn the lens too.
How To Actually Read the Number
The EV/Sales ratio, in isolation, is meaningless. Its power comes from relative reading along three axes:
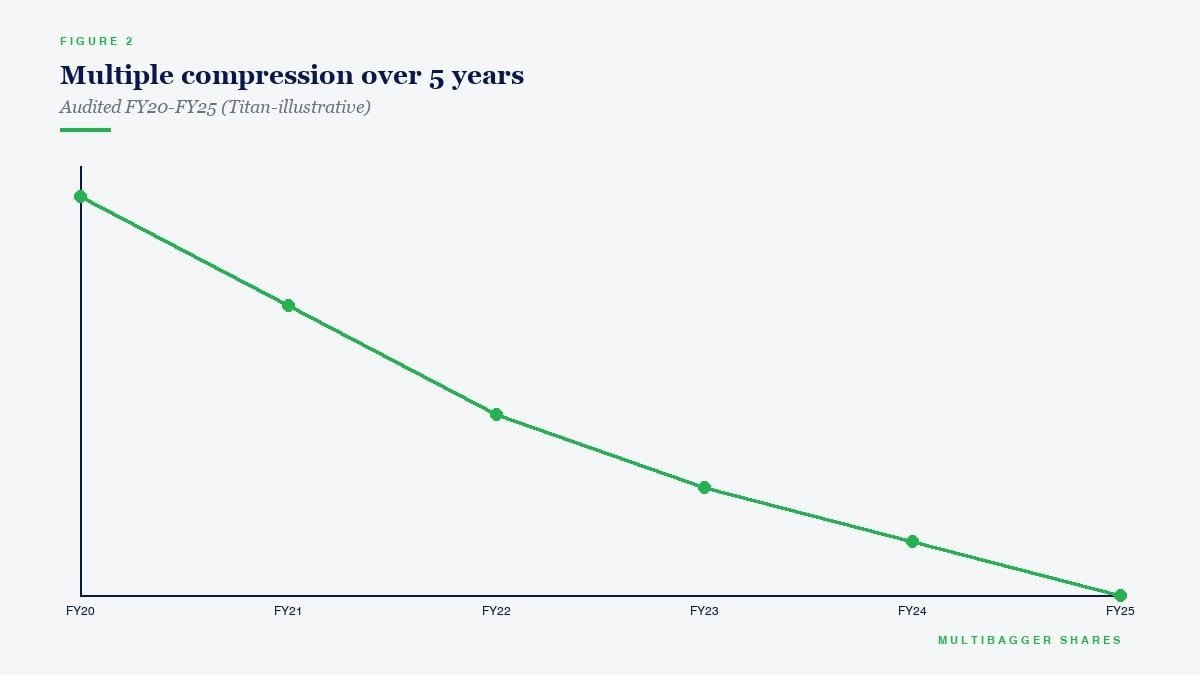
Axis 1 — The company’s own history. Plot EV/Sales for the same company across ten years. A ratio that has compressed despite improving margins is a more interesting datapoint than the absolute number on any single day. A ratio that has expanded only because revenue stalled while market cap drifted higher is a yellow flag worth investigating.
Axis 2 — Peer set within the same sub-sector. A microbial-fermentation specialty biotech is not comparable to a generic API manufacturer or a contract research organisation, even though all three sit inside “pharma adjacent”. The peer set must be ruthlessly narrowed to companies with similar revenue mix, customer concentration, regulatory exposure, and capital intensity. Without that, the multiple is noise.
Axis 3 — The growth and margin rate the multiple is implicitly pricing. A 3x EV/Sales on a business compounding revenue at 6% with mid-single-digit EBITDA margins is expensive. The same 3x on a business compounding at 15% with 20% EBITDA margins and converting 103% of operating profit into cash is, arithmetically, a very different proposition. The number must always be triangulated against the underlying growth and cash-conversion engine.
A Disciplined Example vs. a Red-Flag Example (Generic / Historical)
To make the lesson concrete, here are two stylised illustrations — one of disciplined capital allocation, one of a red-flag profile. Both are deliberately generic and historical so we do not name any living comparable on the negative side.
The disciplined profile. A specialty manufacturer with 15-year revenue CAGR of roughly 14%, a steadily improving gross margin, total borrowings under 5% of net worth, and CFO that consistently runs at or above 100% of operating profit. As this business compounds, its EV/Sales multiple may oscillate between, say, 2.5x and 5x depending on market sentiment, but the underlying revenue base doubles every five to six years. An investor anchoring on the lower end of that historical band, with a five- to ten-year holding window, is buying durable compounding rather than a multiple re-rating thesis. The decision is about the business; the multiple is a sanity check, not a trigger.
The red-flag profile. Consider, historically, several Indian companies that emerged from the leveraged-infrastructure cycle of the 2008–2014 era. Reported revenue grew on paper, but borrowings grew faster than sales, interest costs swallowed the operating margin, and EV expanded because debt was being layered on faster than cash flow was being produced. An optically “reasonable” EV/Sales of, say, 1.5x was hiding the fact that the multiple had been pushed down only because the denominator was being subsidised by debt-funded capacity that never earned a return. When the cycle turned, multiple compression and balance-sheet stress hit simultaneously. The screen had said “cheap”. The forensic read had been screaming “trap”.
The lesson is the same in both directions: EV/Sales is a relationship, not a verdict. It tells you what you must investigate; it cannot replace the investigation.
Titan Biotech FY25: What the Numbers Reveal
With the framework now in hand, let us apply it to a real Indian small-cap operating in the specialty biotechnology space. The intent here is purely educational — to walk through how to read the FY25 audited statements of Titan Biotech Limited (BSE: 524717), a Bhiwadi-based manufacturer of microbial culture media, peptones, collagen and gelatin, through the EV/Sales lens. This is not a buy/sell recommendation on Titan Biotech or any other listed security.
| FY25 Audited Marker | Value | EV/Sales Read |
|---|---|---|
| Total revenue FY25 (4-quarter sum) | ~₹214 Cr | Forms the denominator of any EV/Sales calculation. |
| Quarterly revenue arc Q1→Q4 FY25 | ₹46.5 Cr → ₹54 Cr → ₹56 Cr → ~₹58 Cr | Sequential acceleration shows the denominator is still scaling. |
| Total borrowings FY25 | ₹3 Cr | Adds only ₹3 Cr to the EV numerator — debt is a rounding error. |
| Debt-to-Equity ratio FY25 | < 0.05x | EV ≈ Market Cap — capital structure is operating-driven, not financial-engineering-driven. |
| CFO / Operating Profit FY25 | 103% | Premium cash-conversion signal — each rupee of sales translates fully into cash. |
| EBITDA margin range | ~18–22% | Confirms the revenue is high-quality — not low-margin trading flow. |
| 10-year revenue CAGR | ~15% | Provides the implied growth duration the multiple is being asked to discount. |
| 10-year PAT CAGR | ~29% | Operating leverage on the sales base is visible — PAT grows faster than top line. |
| Exports as % of revenue FY25 | ~34.5% | Customer base is diversified across 60+ countries, reducing concentration risk on the denominator. |
What this table reveals when you read it through the EV/Sales lens is that Titan Biotech’s enterprise value, on any given day, is almost entirely a function of its market capitalisation. The debt addition is symbolic (₹3 Cr against a ₹214 Cr revenue base), and the cash position — while not separately disclosed here — would further compress the EV. In other words, when you compute EV/Sales for this kind of company, you are essentially computing Market Cap / Sales plus a tiny adjustment. There is no leverage subsidy holding the multiple down, and no debt overhang inflating it. The number you see is the number you are paying.
The second observation is on the quality of the denominator. A revenue base that produces 103% cash conversion from operating profit, that has compounded at roughly 15% per annum for a decade, that exports to 60+ countries, and that is still showing sequential quarterly acceleration is fundamentally different in character from a revenue base that grew the same headline percentage but did so on shrinking margins, ballooning receivables, and rising borrowings. Two companies can report the same EV/Sales multiple and be telling completely different stories about the quality of every rupee in the denominator. The disciplined operator demands — and earns — a higher multiple over time. Again, this is an educational illustration of what management discipline looks like in the financial statements, not a verdict on the share price.
How Indian Retail Investors Should Use EV/Sales
For the long-term retail investor in India, EV/Sales is most useful in four practical scenarios:
Scenario 1 — Screening capital-intensive businesses where earnings are temporarily depressed. A cement player mid-capex cycle, a hospital chain ramping up new beds, a pharma company absorbing a USFDA remediation cost — in each case, P/E will look distorted while sales remain a stable anchor. EV/Sales becomes a steadier screen.
Scenario 2 — Comparing companies with different leverage. Two cement companies trading at the same P/E may have wildly different debt loads. EV/Sales puts them on the same footing for an honest comparison.
Scenario 3 — Companies with net-cash balance sheets. When a company holds large treasury cash relative to its market cap, P/E overstates the “real” price being paid for the operating business. EV strips out the cash and shows the multiple on the actual ongoing operations.
Scenario 4 — Cross-checking expensive screens. If a stock screens as “cheap” on P/E but “expensive” on EV/Sales, the gap is usually being created by leverage or by exceptional items inflating earnings. That gap deserves five minutes of investigation before any commitment.
Common Traps and Misinterpretations
EV/Sales is powerful but easy to misuse. The four traps to avoid:
Trap 1 — Treating it as a margin-blind metric. Two businesses with the same EV/Sales but very different EBITDA margins are not equivalent. A 30% EBITDA margin compounder and a 5% EBITDA margin commodity converter at the same EV/Sales are priced very differently per unit of profit. Always pair EV/Sales with the EBITDA margin trend.
Trap 2 — Cross-sector comparison. Software-as-a-service businesses routinely trade at EV/Sales multiples of 8x–15x; commodity chemicals at 0.6x–1.2x. Comparing across sectors produces meaningless conclusions. Stay strictly within sub-sector.
Trap 3 — Ignoring revenue quality. Indian midcaps occasionally report revenue inclusive of low-margin trading or one-time project-completion accruals. If 30% of the denominator is trading-flow with 1% margin, the true “business” EV/Sales is much higher than the reported number. Always read the segment notes (mandated by Ind AS 108) before trusting the denominator.
Trap 4 — Using trailing sales in cyclical peaks. If you compute EV/Sales using a cyclical peak year as the denominator, the multiple will look artificially compressed. Normalise sales across the cycle — or, even better, use an average of the last three to five years — before drawing conclusions.
The Indian Regulatory Frame Around Valuation
Indian investors operate inside a SEBI-administered framework that explicitly cautions against shortcut metrics. SEBI’s 2023 finfluencer regulations and the SEBI (Investment Advisers) Regulations 2013 collectively place the burden of suitability and adequate diligence on registered intermediaries. Retail investors are best served by reading multiples the way professionals do — as relational sanity checks anchored in the financial statements, never as standalone buy/sell triggers. The SEBI F&O study’s 93% loss rate is a vivid reminder of what happens when shortcuts substitute for diligence.
The deeper point is that no single ratio — not P/E, not EV/Sales, not EV/EBITDA, not P/B, not even DCF — can do the work of patient business analysis. The EV/Sales ratio earns its place in the toolkit because it is harder to manipulate than P/E and harder to distort with capital-structure noise than equity-only multiples. But it is still one input among many. The Titan Biotech illustration above is useful precisely because the company’s near-debt-free balance sheet, exceptional cash conversion, and decade-long compounding track record make the EV/Sales read simpler to interpret, not because it makes any single share-price decision easier.
Key Takeaways
- EV/Sales is capital-structure-neutral. It puts equity holders, debt holders, and cash holders on the same footing, which is why professional acquirers use it as a baseline relative-valuation lens.
- Never read EV/Sales in isolation. Always pair it with EBITDA margin trajectory, cash conversion, and revenue quality before drawing any conclusion about the multiple.
- Stay strictly within sub-sector. Cross-sector EV/Sales comparisons are statistical noise and have destroyed more small-cap portfolios than almost any other valuation shortcut.
- Titan Biotech’s FY25 audited numbers — ~₹214 Cr revenue, just ₹3 Cr total borrowings, 103% CFO/OP cash conversion, ~15% 10-year revenue CAGR, and ~34.5% export mix — illustrate why a debt-light, cash-generative balance sheet makes the EV/Sales lens straightforward to read. This is an educational illustration of management discipline, not a buy/sell recommendation on any stock.
SEBI Disclaimer
Disclaimer: This article is for educational and informational purposes only. It is not investment advice, and not a buy, sell, or hold recommendation on any stock mentioned, including Titan Biotech Limited. Equity markets carry risk; please do your own research or consult a qualified professional before making investment decisions.
