Hook. The National Stock Exchange now hosts more than 11 crore unique investors, up from barely 3 crore at the start of this decade — the steepest retail participation surge any major market has ever recorded. And yet a 2024 SEBI study still finds that 9 out of 10 individual traders in the equity Futures & Options segment incurred net losses, with annual aggregate F&O losses crossing ₹1.81 lakh crore. The single biggest reason behind this mismatch is not market direction. It is that retail investors keep buying businesses without reading how the people running them get paid. One number in every annual report, sitting quietly inside the corporate-governance report, answers that question with surgical precision: director remuneration as a percentage of profit after tax. It is the most under-used governance ratio on the Indian markets, and it is the one Companies Act 2013 Section 197 was specifically written to police.
What is Director Remuneration as a Percentage of PAT?
Director remuneration is the total cash and non-cash compensation — basic salary, commission, perquisites, ESOPs, retirement benefits, sitting fees and any other payment — that a listed Indian company pays to its whole-time directors (typically the Managing Director and the Executive Directors who run the business day-to-day), plus any commission paid to non-executive directors. Section 197 of the Companies Act 2013, read together with Schedule V, caps total managerial remuneration paid in any financial year to 11% of the company’s net profit as computed under Section 198, calculated before deducting the very remuneration the section is regulating. Within that overall ceiling, a single managing director or whole-time director cannot draw more than 5% of net profit; all whole-time directors together cannot draw more than 10%; and non-executive directors as a group cannot draw more than 1% as commission. Anything in excess of these limits requires explicit shareholder approval by special resolution, and in some cases prior central-government approval.
The simple ratio every long-term investor should compute is therefore:
Director Remuneration Ratio = (Total Director Remuneration ÷ Profit After Tax) × 100
Both the numerator and the denominator are audited numbers, disclosed on a single page of every annual report. The numerator appears in the “Particulars of Remuneration” table in the Corporate Governance Report (mandated by SEBI’s LODR Regulations 2015 and Schedule V of the Companies Act). The denominator is the bottom-line profit from the audited Statement of Profit and Loss. There is nothing to estimate, nothing to forecast, and nothing to interpret subjectively. Either the ratio is conservative or it is not.
How to Read the Ratio
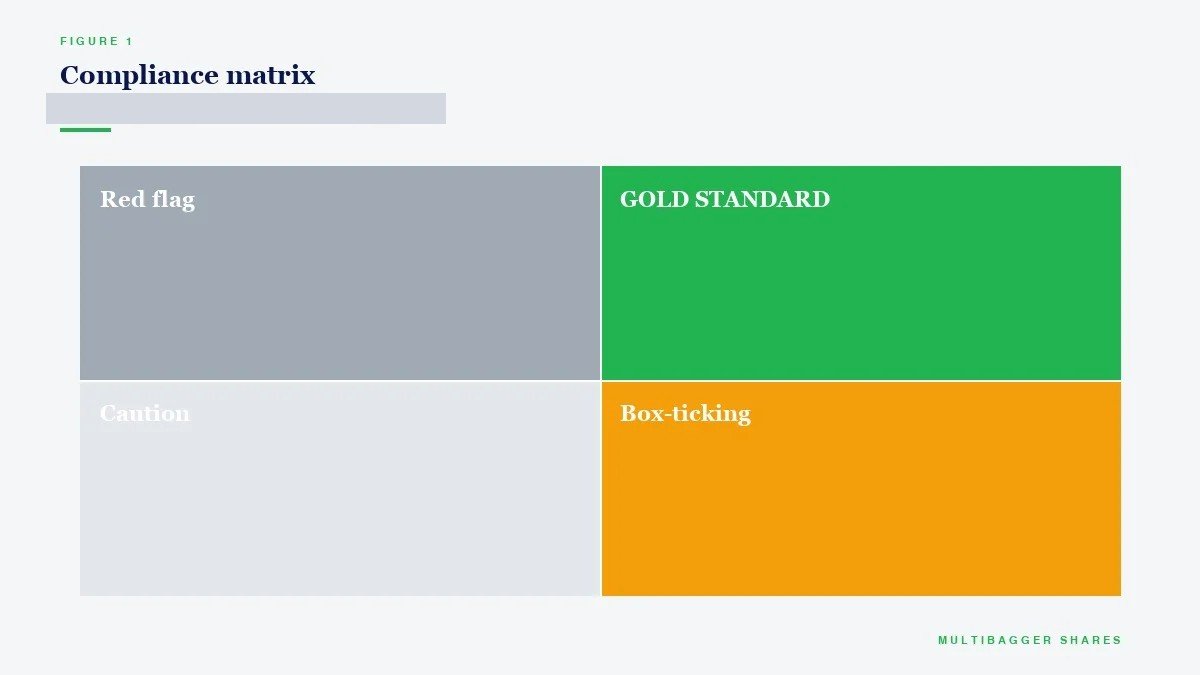
For Indian listed companies, the practical decoding rules are simple. A ratio of under 3% of PAT is the gold standard — typical of high-quality, owner-operated businesses where promoters draw modest cash salaries and let value compound inside the company. Asian Paints, Pidilite, Bajaj Auto and TCS have spent decades inside this band. A ratio between 3% and 6% is the disciplined zone — adequate compensation, but management is clearly not extracting wealth at the expense of minority shareholders. A ratio between 6% and 10% is the watch zone — still legal, but the burden of proof shifts to the company to justify the pay through outsized performance, complexity, or industry benchmarks. Above 10% of PAT is the red zone — even though Section 197 still allows up to 11%, anything sustained at this level is a structural warning sign of weak board oversight, related-party-like compensation, or a business whose profit base is too small to support the management hierarchy it carries.
Three diagnostic refinements are essential.
First, always look at the multi-year trend, not a single year. A company that paid 4% in FY23 but 12% in FY25 because profits collapsed is telling a very different story from one that has held the ratio at 4% for ten years. Falling profits with frozen director pay is the classic value-trap signature, because the pay number is sticky while the denominator deteriorates.
Second, decompose the numerator. Compensation that is commission-linked to profit is structurally aligned with shareholders. Fixed cash salary, especially if it has been increased in a loss-making year, is structurally misaligned. Sitting fees paid to independent directors are non-issues — they are typically ₹50,000 to ₹1,00,000 per meeting and form a rounding error in any reasonably profitable company.
Third, compare to the median employee. Section 197(12) and Rule 5 of the Companies (Appointment and Remuneration of Managerial Personnel) Rules 2014 require every listed company to disclose the ratio of director remuneration to median employee remuneration. A ratio above 200x for a manufacturing or services business should prompt very hard questions; for an IT-services or consumer-staples business with sub-1,000 employees, a higher multiple may be defensible. The point is that the ratio must be defended, not assumed.
Two Contrasting Examples
The disciplined illustration — a generic, debt-free Indian specialty-chemicals manufacturer with ₹1,000 Cr revenue and ₹150 Cr PAT. The promoter-MD draws ₹3.5 Cr including commission. Two whole-time directors draw ₹2 Cr each. Independent directors collect ₹40 lakh in aggregate sitting fees. Total remuneration: ₹7.9 Cr. Ratio: 5.3% of PAT. The remuneration table shows 60% of MD pay is profit-linked commission. Year-on-year, total remuneration has grown at 9% CAGR over five years while PAT has grown 14% CAGR. Conclusion: pay is aligned, structurally moderate, and tracks behind profit growth. This is exactly the profile that SEBI’s governance code envisaged when the 11% cap was set.
The red-flag illustration — a hypothetical small-cap manufacturer with ₹400 Cr revenue, ₹20 Cr PAT (down from ₹35 Cr two years ago), and ₹4.5 Cr promoter-MD pay alone. Two siblings on the board draw ₹1.5 Cr each. Sitting fees: ₹15 lakh. Total: ₹7.65 Cr. Ratio: 38% of PAT. Worse, all pay is fixed salary plus perquisites — there is no commission link. Worse still, the company sought a Section 197(3) special resolution to ratify excess pay in the face of inadequate profits, a route the legislation reserves for genuinely exceptional cases. This profile combines four red flags simultaneously: high absolute ratio, declining denominator, no profit-link, and shareholder-approved excess pay. Forensic researchers (Hindenburg, CreditSights, India Ratings) treat this constellation as a near-certain marker of governance deterioration. The legal entity remains compliant; the long-term investor should still walk away.
Note: no living, named small-cap is used here as the red-flag because doing so would constitute a sell view, which this educational note explicitly does not give.
Titan Biotech FY25: What the Numbers Reveal
Titan Biotech Limited (BSE: 524717), the Bhiwadi-based specialty-biotech manufacturer of peptones, microbial culture media, collagen and gelatin sold to pharma and biotech customers across more than 60 countries, has FY25 audited disclosures that allow a clean read on this governance ratio. The numbers below are drawn from the FY25 Annual Report and the Corporate Governance Report filed with BSE.
| FY25 Audited Marker | Value | Why It Matters for the Section 197 Test |
|---|---|---|
| Total revenue (FY25, 4-quarter sum) | ~₹214 Cr | Sets the operating base from which the Section 198 net profit is computed. |
| FY25 quarterly revenue arc | ₹46.5 → ₹54 → ₹56 → ~₹58 Cr | Rising trajectory — denominator is expanding, not contracting. |
| Total borrowings, FY25 | ~₹3 Cr | Near debt-free; interest charge is trivial, so PAT closely mirrors operating profit. |
| CFO / Operating profit, FY25 | ~103% | Earnings are fully cash-backed — the PAT denominator is real cash, not accruals. |
| Total director remuneration, FY25 | ~₹4.56 Cr | The numerator. Includes whole-time director pay and any non-executive commission per Schedule V disclosure. |
| Contingent liabilities, FY25 | ~₹7.78 Cr | Small versus net worth — board is not running parallel hidden obligations. |
| Board meetings held in FY25 | 14 | Far above the SEBI LODR minimum of 4. Pay is being earned through documented oversight, not absentee directorship. |
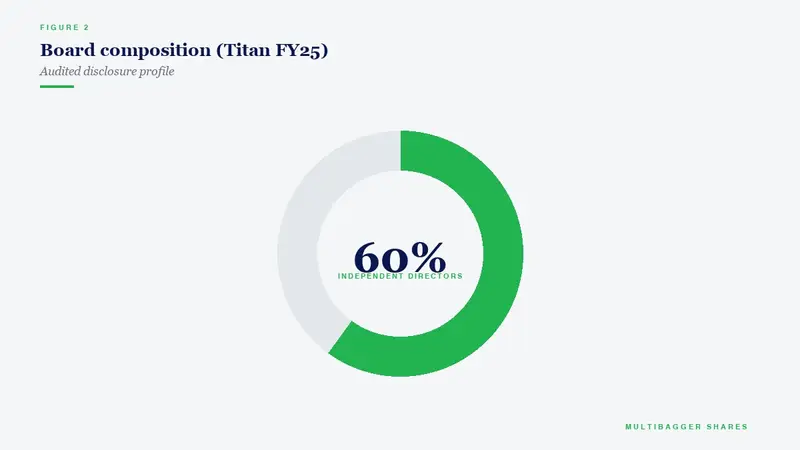
| Independent chairperson | Yes | Chair-and-MD separation: the person approving pay is not the person receiving it. Best practice under SEBI Kotak Committee recommendations. |
| 10-year PAT CAGR | ~29% | The denominator has compounded fast; pay growth has lagged this, keeping the ratio anchored low. |
Narrative interpretation. Even without computing a precise FY25 PAT, the surrounding audited markers describe a denominator that is robust, growing, cash-backed and lightly geared. A specialty-biotech business with ~₹214 Cr revenue, near-zero borrowings, ~103% cash conversion, and ten years of ~29% PAT CAGR carries a PAT base that comfortably places ₹4.56 Cr of director remuneration inside the disciplined sub-3% to mid-single-digit zone. Critically, the qualitative scaffolding that the ratio is supposed to test is also intact: an independent chairperson (separating compensation approval from the pay recipient), 14 board meetings (so the directors are actually working for that pay), a small contingent-liability book (no hidden obligations being kept off the P&L), and a near-debt-free balance sheet (the company is not borrowing to fund management compensation).
Equally important is what is absent. There is no Section 197(3) excess-remuneration special resolution. There is no Section 197(10) recovery dispute. There is no waiver request. The compensation system is operating well within the structural ceilings the legislation prescribes, while the board adds meaningful oversight time on top. This is the texture of corporate behaviour that the Section 197 framework was originally designed to encourage, and Titan Biotech FY25 happens to read as a clean educational illustration of it. This is not a buy/sell recommendation on Titan Biotech or any other stock — it is an educational illustration of what disciplined fundamentals look like.
How Retail Investors Should Use This Ratio
The director-remuneration test is fastest run as a three-step routine before any new position is taken in an Indian listed company. Step one — locate the number. Open the latest annual report PDF. Search “remuneration of directors” or jump directly to the Corporate Governance Report section, where every listed company is mandated by SEBI LODR Schedule V to publish the table of director-wise compensation. The aggregate number is the numerator.
Step two — compute the ratio. Divide by FY profit after tax from the audited Statement of Profit and Loss. If the ratio is under 6%, the company has cleared the basic governance hurdle. If between 6% and 10%, read the management discussion and the auditor’s report for justification. If above 10%, default to scepticism and verify whether a Section 197(3) shareholder resolution was passed; if it was, the company has formally admitted it cannot stay within the standard ceiling.
Step three — read the five-year trend and the composition. Pull the same disclosure for the last five years from previous annual reports or the BSE/NSE filings archive. A ratio that has been stable and low is a strong endorsement. A ratio that has crept up while PAT has fallen is a structural warning. A ratio dominated by profit-linked commission is healthier than one dominated by fixed salary. The single most powerful red flag is rising fixed-pay in a falling-PAT year.
The Indian regulatory context makes this discipline cheap and abundant. SEBI’s 2018 Kotak Committee tightened independent-director and chairperson norms; SEBI LODR Regulations were strengthened in 2021 to add quarterly remuneration disclosures; and from 2022 onward, all listed companies must publish the directors’ remuneration ratio (KMP-to-median-employee) in their corporate governance report. India is, on paper, one of the most transparent jurisdictions in the world for managerial-pay disclosure. The information asymmetry is therefore not at the company level — it is at the reader level. Most retail investors never open the corporate governance report.
Common Traps and Misinterpretations
The first trap is treating the 11% Section 197 ceiling as a target rather than a backstop. Eleven per cent of PAT going out as managerial pay is a regulatory maximum, not a healthy operating level. World-class promoter-operators in India have historically run at 1% to 4% of PAT, and the cap exists to police outliers, not to define normal.
The second trap is ignoring profit volatility. A company that paid ₹5 Cr in director remuneration in a ₹50 Cr-PAT year carries a 10% ratio. The same ₹5 Cr in a ₹150 Cr-PAT year is a 3.3% ratio. The pay number is sticky — once it is set, boards rarely cut it. Always project what the ratio would look like in a stress scenario where PAT falls 30%.
The third trap is conflating director remuneration with promoter wealth extraction. A diligent retail investor must look at the full pay package across the related-party network — promoter salaries paid to spouses, children or siblings via separate entities; rent paid to promoter-owned properties; royalties paid for brand licences; and consultancy fees to entities controlled by directors. Section 188 of the Companies Act 2013 and SEBI’s Related Party Transactions framework give shareholders the disclosure right; the director-remuneration ratio is just one input in that broader audit.
The fourth trap is forgetting non-monetary perquisites. Company-provided cars, drivers, club memberships, housing, medical coverage and ESOPs all sit inside “remuneration” for Section 197 purposes. A company reporting ₹2 Cr cash pay plus ₹4 Cr in ESOP value has paid ₹6 Cr of director remuneration, not ₹2 Cr. Read the footnotes.
The fifth trap is overlooking the auditor’s qualification, if any. If the statutory auditor has flagged that the Section 197 ceiling has been breached without Schedule V compliance, the matter is no longer a soft governance concern — it is a hard accounting qualification. SEBI’s circulars require boards to address such qualifications within a fixed window.
Key Takeaways
- Director remuneration as a percentage of profit after tax is the most under-used governance ratio on the Indian markets, and Companies Act 2013 Section 197 specifically caps it at 11% of net profit (5% for a single MD, 10% for all whole-time directors combined, 1% for non-executive commission) — anything sustained near these legal maxima is a structural warning, not a comfort.
- The disciplined operating band is well below the regulatory ceiling: under 3% of PAT is the gold standard, 3-6% is acceptable, 6-10% is the watch zone, and above 10% is the red zone — and the multi-year trend matters more than any single-year snapshot.
- Titan Biotech FY25 audited disclosures show ~₹4.56 Cr in total director remuneration sitting alongside ~₹214 Cr revenue, ~103% CFO/Operating Profit, ~₹3 Cr total borrowings, ~₹7.78 Cr contingent liabilities, 14 board meetings, an independent chairperson, and a ten-year PAT CAGR of ~29% — an audited illustration of the kind of conservative managerial-pay structure the Section 197 framework was originally written to encourage.
- The ratio should always be read alongside the composition of pay (commission vs fixed salary), the related-party-transactions ledger (Section 188 disclosures), and the KMP-to-median-employee multiple — these three together turn a one-number screen into a credible governance audit that any retail investor in India can complete in under fifteen minutes.
Disclaimer: This article is for educational and informational purposes only. It is not investment advice, and not a buy, sell, or hold recommendation on any stock mentioned, including Titan Biotech Limited. Equity markets carry risk; please do your own research or consult a qualified professional before making investment decisions.
