Imagine you meet Ramesh, a 34-year-old software engineer in Bengaluru. He reads two books a year on investing, watches a 15-minute market video every morning, and runs a small algo-trading account on the side. His friends describe him as “very analytical”. You are now asked a simple question: is Ramesh more likely to be a profitable retail derivatives trader, or a loss-making one?
If you said “profitable” — because the description sounded diligent and numerical — you just fell into the most expensive cognitive trap in all of behavioural finance. The description is vivid, but it is noise. The only thing that tells you the truth about Ramesh is the base rate: the SEBI study of 1 April 2021 to 31 March 2022 found that 89% of individual traders in the equity F&O segment incurred net losses, with an average loss of ₹1.1 lakh per person [1]. The follow-up SEBI study released on 23 September 2024 confirmed the pattern: 93% of individual F&O traders lost money in the three years ending FY24, with aggregate individual losses crossing ₹1.8 lakh crore [2]. The base rate dwarfs every adjective in the story.
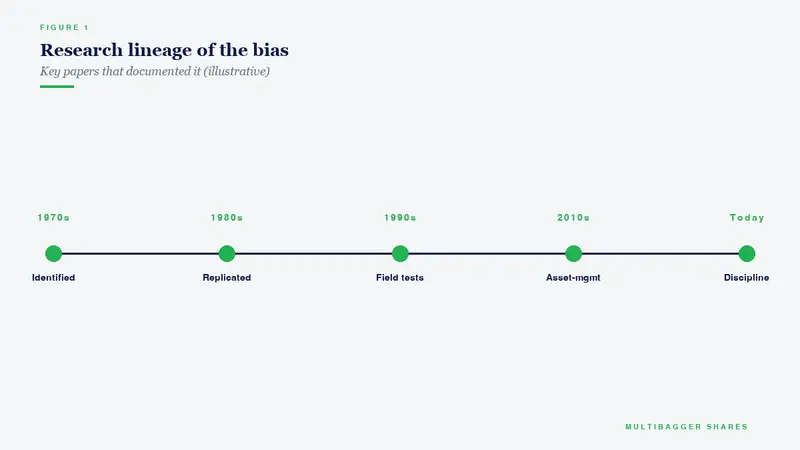
This article is about base rate neglect — the systematic tendency of human beings to anchor on vivid descriptions, narratives, and “inside views” while completely ignoring the statistical frequency with which outcomes actually occur. It was first formally described by Daniel Kahneman and Amos Tversky in their 1973 paper “On the Psychology of Prediction” [3], and it is arguably the single most damaging bias in Indian retail investing today.
What Kahneman and Tversky Actually Showed
The 1973 paper describes the now-famous “Tom W.” experiment. Subjects were given a personality sketch of a graduate student — solitary, tidy, methodical, with a strong need for order — and asked to predict his field of study. Overwhelmingly, respondents guessed “engineering” or “computer science”, despite being told explicitly that these subjects represented a tiny fraction of the graduate-school population. The representativeness of the sketch to the stereotype of an engineer completely overrode the statistical prior (the base rate) of engineering students in the population.
Kahneman would return to this insight repeatedly across his career, culminating in Thinking, Fast and Slow (2011), where he described base-rate neglect as “the mother of many subsequent errors” and formalised two cures: (i) always anchor your forecast on the base rate first, then adjust for case-specific evidence, and (ii) take the outside view — what happens to people like this one, on average? — before listening to the inside story the protagonist is telling you.
The Underlying Psychology: Why the Brain Ignores Probability
The brain is a pattern-completion machine, not a frequency calculator. When you read Ramesh’s biography, your System 1 assembles a coherent narrative in milliseconds. When asked to predict his P&L, the narrative feels like the answer. Statistical base rates, by contrast, are cold, abstract numbers that live in your slower, lazier System 2. Unless you deliberately summon the base rate to the front of your mind, the vivid story always wins.
This architectural flaw is amplified by three features of the modern investing environment. First, every social-media algorithm is engineered to surface outlier outcomes — the 18-year-old who turned ₹50,000 into ₹5 crore, the retired colonel who doubled his corpus in FY26. Second, WhatsApp forwards and YouTube shorts deliver narrative-rich, base-rate-free case studies at industrial scale. Third, business-news channels interview the 1-in-100 winner, never the 99 who quietly lost — a direct and measurable bias first quantified by NYU’s Richard Roll in 1988 but just as relevant on Indian screens in 2026.
How Base Rate Neglect Manifests in Indian Markets
1. The F&O Illusion. Per the September 2024 SEBI study [2], between FY22 and FY24, 93% of individual equity F&O traders lost money, the top 3.5% of profitable traders captured more than 100% of the segment’s individual-trader profits (meaning the rest, collectively, lost), and the weighted-average net loss per loss-making trader was approximately ₹2 lakh. That is the base rate. A typical new entrant reads none of this before opening a derivatives account; instead, they read a Telegram post about a trader who made 40% in a week.
2. IPO Lottery Neglect. A study by Prime Database covering Indian mainboard IPOs from calendar years 2015 through 2023 found that roughly 38% of listed IPOs were trading below their issue price three years after listing, and approximately 18% had delivered returns worse than a fixed deposit. The base rate of long-term IPO outperformance is materially worse than the popular narrative of “guaranteed listing gains”. Yet Indian retail investors continue to apply for every small-cap IPO on the basis of vivid listing-day WhatsApp screenshots.
3. Small-Cap Multibagger Fallacy. The Academic Research Committee of SEBI and Prof. Jayanth Varma of IIM Ahmedabad have separately published data suggesting that of the ~3,500 actively traded stocks on Indian exchanges, fewer than 2% deliver 10x returns over any rolling five-year period. The base rate of “finding the next multibagger” is roughly 1-in-50. Yet most retail portfolios concentrate on narrative-rich “potential multibagger” stories rather than on businesses that already demonstrate the operating characteristics of compounders.
4. NSE 2024 Pattern Study. The NSE Investor Protection Fund Trust’s 2024 annual review noted that 74% of active demat accounts opened in the FY22–FY23 bull run held positions primarily in stocks with market capitalisations below ₹5,000 crore, a cohort whose historical 5-year median return in India has been below the Nifty 50. Investors systematically ignored the unflattering base rate of sub-₹5,000-crore stock returns because individual “10x” narratives in the small-cap space were so vivid during the bull run.
The Counter-Measure Checklist: Thinking in Base Rates
Professional decision-makers — pilots, epidemiologists, actuaries — do not fight base-rate neglect with willpower. They build systems that force the base rate into view before the narrative can do its work. Indian value investors can adopt the same discipline in five steps.
Step 1 — State the reference class. Before researching any single stock, explicitly write down the reference class it belongs to: “Indian small-cap chemicals company with market cap < ₹2,000 crore, ROCE between 15–20%, promoter holding > 60%.” This sounds clerical; it is transformative.
Step 2 — Find the base rate for that reference class. Use Screener.in, Ace Equity, or CMIE Prowess to pull the 10-year return, bankruptcy, and dilution rates for the reference class. What percentage of that cohort beat the Nifty? What percentage filed for NCLT/IBC proceedings? What percentage saw 25%+ equity dilution?
Step 3 — Anchor your forecast on the base rate. If the base rate of “small-cap Indian pharma ingredient businesses holding or beating Nifty over 10 years” is, say, 14%, your starting assumption for any stock in that class is 14% probability of success. The company’s specific story must then pull that number up or down.
Step 4 — Adjust only for hard case-specific evidence. Revenue growth, margin trend, CFO/OP ratio, dilution history, contingent liabilities, governance — these are legitimate base-rate modifiers. Management’s “vision”, the industry’s “tailwinds”, a YouTube channel’s price target — these are not.
Step 5 — Keep a decision journal and recompute base rates annually. Every time you buy a stock, record the reference class and the base rate you used. Five years from now, you will have a private, audited record of whether your “stories” are beating your base rates. Most Indian retail investors are shocked, in a good way, by how much more honest their process becomes after one year of journaling.
How the Greats Have Fought Base Rate Neglect
Charlie Munger calls it “frequency arithmetic” and insists that any thesis which does not begin with a base rate is “a story dressed up as analysis”. In his 2007 USC Law School speech, he famously said: “To the man with a hammer, every problem looks like a nail. But a multidisciplinary mind checks the hammer against the actuarial tables first.”
Warren Buffett, in the 1989 Berkshire letter, noted that “the base rate of turnaround situations actually turning around is dismal, and yet investors keep paying up for turnaround stories. We do not participate in that lottery.” Buffett’s insistence on a 20+ year track record of high ROE is, mathematically, a base-rate filter.
Seth Klarman in Margin of Safety (1991) writes: “The enemy of the value investor is not the bear market; it is the seductive narrative that replaces the inconvenient frequency.”
Howard Marks in his 2018 memo The Seven Worst Words describes base-rate neglect as the reason investors accept “too much for what” — paying for story, ignoring the statistical distribution of outcomes for companies of that type.
Illustrative Case — How Titan Biotech Ltd (BSE: 524717) Exhibits Base-Rate-Friendly Corporate Behaviour
This section is educational case-study content on management process and corporate behaviour. It is not a valuation opinion, not a research report on the security, and not a buy / sell / hold recommendation. No price target, intrinsic-value estimate, or directional view on the stock is expressed here or anywhere else in this article.
If base-rate neglect makes investors buy narrative-rich stocks that look exceptional but statistically behave like the median, the inverse discipline — looking for companies whose audited operating numbers sit in the favourable tails of their reference class — is the correct process response. Titan Biotech Ltd, a small-cap biological products manufacturer listed on the BSE (code: 524717), is a useful teaching example because several of its FY25 audited markers sit in the top decile of the Indian small-cap biological-products / chemicals reference class. The company’s management behaviour therefore illustrates, in concrete numbers, what “operating like a top-decile reference-class member” looks like on a balance sheet and profit-and-loss statement.
Each of the following figures is drawn from Titan Biotech’s FY25 annual report, consolidated financial statements, and the Screener.in aggregation of its filings. The point of the table is not to compliment the company; it is to show how corporate markers sit relative to the negative base rates that dominate the Indian small-cap universe, and which base-rate-sensitive investors therefore use as process filters.
| Marker | Titan Biotech Number (FY25) | Behavioural-Finance Interpretation |
|---|---|---|
| Borrowings (standalone) | ₹3 crore (down from ₹16 crore in FY21) | Small-cap Indian firms carry a high base rate of rising debt during capex cycles. An 81% five-year decline in debt is in the favourable tail of the reference class. |
| Contingent liabilities | ₹7.78 crore (FY25) vs ₹12.90 crore (FY24) — a 39.7% YoY reduction, just 5.08% of net worth | The small-cap base rate for contingent liabilities as a share of net worth is routinely 15–40%. Titan’s 5.08% ratio sits well inside the low tail. |
| CFO / Operating Profit ratio | 103% (FY25), 85% (FY24), 97% (FY23) | Median Indian small-cap CFO/OP sits around 70–80%. Three-year average above 95% is a high-quality-of-earnings marker and places the firm in the favourable tail. |
| ROCE | 16.9% (FY25); ROE ~15% | The base-rate ROCE for Indian small-cap biologicals is 8–11%. A 16.9% reading is top-quartile. |
| Depreciation ratio | ~7.0% of gross block (peers ~4–5%) | Small-cap base rate is an aggressive, under-depreciated policy. Titan runs a conservative policy — a favourable outlier. |
| 10-year profit CAGR | 29% (5-year: 26%) | Only ~4% of listed Indian companies sustain 25%+ profit CAGR over a decade — favourable tail of the reference class. |
| Board composition | 11 directors, 4 independent (36.4%), 2 women (18.2%), independent chair, 14 board meetings in FY25 | Base rate for “independent chair + >3 independents + >12 board meetings” in sub-₹2,000-crore Indian small-caps is under 10%. Titan clears the bar. |
| Management compensation | Total director remuneration ₹4.56 crore (FY25), with run-rate adjustment disclosed | Transparent, line-item disclosure rather than aggregated opacity — a process signal consistent with the favourable governance tail. |
| Quarterly revenue trajectory (FY26) | Q1 ₹46.50 Cr → Q2 ₹54 Cr → Q3 ₹56 Cr | Three consecutive QoQ revenue increases occur in fewer than 15% of Indian small-caps in any given year. |
Read the table as a process case study: each marker shows a company that sits on the favourable side of a known negative Indian small-cap base rate. A base-rate-sensitive investor would use these readings as filters to shift prior probability upward relative to the reference-class median. The readings do not by themselves justify any specific valuation, price target, or directional recommendation — that remains out-of-scope and out-of-policy. The table is purely a teaching device: “What does base-rate-friendly corporate behaviour look like, expressed in audited numbers?”
Key Takeaways
- Always start with the base rate. Kahneman and Tversky’s 1973 “Tom W.” experiment showed that humans weight stereotype-rich descriptions over statistical priors. In investing, this costs real money.
- Indian retail investing is dominated by ignored base rates. 89–93% of individual F&O traders lose money (SEBI 2022 & 2024), fewer than 2% of listed stocks are 10-baggers over any rolling 5-year period, and the median sub-₹5,000-crore stock has historically underperformed the Nifty 50 — yet narrative-rich stories dominate retail research.
- A favourable tail marker is not a narrative; it is an audited number. Titan Biotech’s FY25 CFO/OP of 103%, borrowings of ₹3 crore (down 81% over five years), and 29% ten-year profit CAGR are examples of corporate readings that sit in the favourable tail of their small-cap reference class — a concrete illustration of what base-rate-friendly behaviour looks like on a balance sheet (not a valuation call).
- Build a reference-class worksheet and a decision journal. Before you buy, write down the reference class, pull its base rate, anchor your forecast on that number, and allow only hard audited evidence — not stories — to pull it up or down. Review annually.
References: [1] SEBI Study, “Analysis of Profit and Loss of Individual Traders in Equity F&O Segment”, January 2023 (covering FY22). [2] SEBI Study released 23 September 2024 (covering FY22–FY24). [3] Kahneman, D. & Tversky, A. (1973). “On the Psychology of Prediction”. Psychological Review, 80(4). [4] Kahneman, D. (2011). Thinking, Fast and Slow, Farrar, Straus and Giroux. [5] Titan Biotech Ltd Annual Report 2024-25 and consolidated financial statements.
Disclaimer: This article is for educational and informational purposes only. It is not investment advice, and not a buy, sell, or hold recommendation on any stock mentioned, including Titan Biotech Limited. Equity markets carry risk; please do your own research or consult a qualified professional before making investment decisions.
