India now has over 11 crore unique investors registered with NSE as of 2025 — up from barely 3 crore at the start of the decade. The 2024 SEBI study on the equity Futures & Options segment found that 93% of individual F&O traders lost money, with aggregate retail F&O losses crossing ₹1.81 lakh crore over FY22–FY24. The simultaneous SEBI clampdown on finfluencers in 2024–25 was the regulator’s polite way of saying that the average Indian investor is buying narratives faster than they are reading balance sheets. The single most under-used skill in the country today is the willingness to spend forty-five minutes inside an annual report looking for forensic red flags before pressing a buy button.
This article teaches you one of the most under-used forensic tools in modern equity research: James Montier’s Modified C-Score, a six-variable “Cooking the Books” detector built specifically to catch the accounting manipulations that Beneish M-Score and Piotroski F-Score were not designed to flag. We will walk through every variable, work through the arithmetic, contrast a disciplined manufacturer with a generic red-flag profile, and then use Titan Biotech Limited (BSE: 524717) FY25 audited numbers as the positive illustration of what a 0/6 score on this forensic model looks like in a real Indian small-cap. This is an educational note, not a buy/sell recommendation on any stock.
What Is the Modified C-Score?
The C-Score — sometimes called the “Cooking the Books” score — was introduced by James Montier in 2008, then a strategist at Société Générale and today a senior member of the GMO asset allocation team in Boston. Montier’s worry, formed across the dot-com unwind and the run-up to the 2008 global financial crisis, was simple: most retail investors were running screens for cheapness without first running screens for honesty. Cheap-but-cooked is the most expensive trade in financial history. He published the model in his note “Cooking the Books, or, More Sailing Under the Black Flag,” and later expanded it inside his book Value Investing: Tools and Techniques for Intelligent Investment.
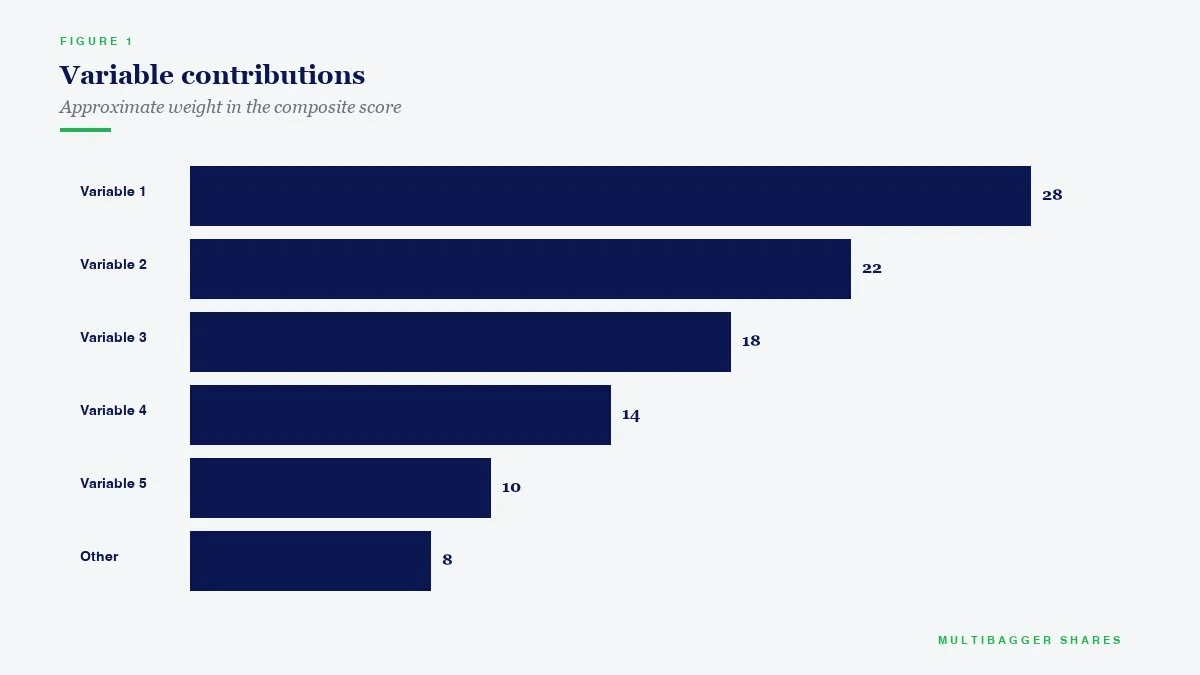
The Modified C-Score is a six-variable scoring system. Each variable answers a single yes/no question of the form: “Is this line on the financials behaving the way an earnings-managing management team would make it behave?” Every “yes” scores one point. A company can score anywhere from 0 (no red flags) to 6 (six simultaneous red flags). Montier’s back-test showed that high C-Score companies (5 or 6) underperformed the broader market by an average of roughly 8% a year and produced a vastly higher subsequent bankruptcy rate than the low-C-Score cohort.
The Modified C-Score is intentionally complementary to two other forensic models long-term Indian investors should already know:
- Beneish M-Score (1999): 8 variables, designed to catch revenue-side manipulations such as the famous Enron and WorldCom playbooks. Output is a probability of manipulation.
- Piotroski F-Score (2000): 9 variables, designed to identify positive financial strength among already-cheap value stocks. Output is 0 to 9, higher is better.
- Montier Modified C-Score (2008): 6 variables, designed to flag specifically the accruals-and-working-capital signatures of earnings games. Output is 0 to 6, lower is better.
The three are not substitutes. They are layered filters. A disciplined Indian investor running all three across a watchlist of 30 small-caps will end up with a forensically clean shortlist far faster than someone running a single ratio screen.
The Six Variables — In Plain Language
Each variable is a binary 1/0 flag. Score 1 if the condition is met (red flag present), 0 otherwise. Sum the six.
Variable 1 — Divergence Between Net Income and Cash Flow from Operations
Net income that consistently runs ahead of cash flow from operations (CFO) is the single oldest tell in earnings management. If a company books revenue but never sees the rupee land in the bank, the gap shows up as a rising “trade receivables” line and a CFO that lags reported PAT. Score 1 if CFO is materially below net income over the trailing year (or, in a stricter reading, if CFO < net income for two consecutive years). Score 0 if CFO is at or above net income — meaning the earnings are cash-backed.
Variable 2 — Growing Days Sales Outstanding (DSO)
Days Sales Outstanding measures how long, on average, a company takes to convert credit sales into cash. Rising DSO — especially against a backdrop of flat or modest revenue growth — is a textbook signature of channel stuffing, end-of-quarter pull-forwards, or aggressive credit terms used to manufacture top-line growth. Score 1 if year-on-year DSO has expanded meaningfully (Montier suggested using the change relative to the prior period). Score 0 if DSO is stable or shrinking.
Variable 3 — Growing Days Sales of Inventory (DSI)
If inventory is rising faster than sales, one of two things is happening: either demand has weakened and management has not yet written down stock to net realisable value, or the company is capitalising costs into inventory that should be expensed. Either way, future earnings are being borrowed against. Score 1 if DSI has expanded year-on-year, 0 otherwise.
Variable 4 — Increasing Other Current Assets Relative to Revenues
“Other current assets” is the bucket where forensic accountants tell you to look first, because it is the part of the balance sheet least regulated by accounting standards. A meaningful build-up in unbilled revenue, prepayments to related parties, advances to suppliers, or “amounts recoverable” — particularly when growing faster than sales — is a strong indicator that costs are being parked on the balance sheet rather than running through the profit and loss account. Score 1 if other current assets / revenue has risen year-on-year.
Variable 5 — Declining Depreciation Relative to Gross Property, Plant & Equipment
The most boring manipulation in the playbook is also one of the most common: stretch the useful life of fixed assets, and depreciation drops, and reported profit rises — without a single rupee of real economic improvement. Score 1 if the ratio of depreciation to gross block has fallen meaningfully year-on-year. Score 0 if it is stable. Indian accounting under Schedule II of the Companies Act, 2013 sets indicative useful lives, but managements have discretion to depart on disclosure — which is exactly why this ratio merits inspection.
Variable 6 — High Total Asset Growth
This is the variable retail investors find the most counter-intuitive. Surely growing the asset base is good? Montier’s answer is: not when the growth is acquisition-led, debt-funded, or front-loaded with goodwill and other intangibles that will need to be tested for impairment every year. The empirical “asset growth anomaly” (Cooper, Gulen and Schill 2008, Journal of Finance) documents that the highest-asset-growth quintile of public companies underperforms the lowest-asset-growth quintile by roughly 8% a year over long horizons in the US. Score 1 if total assets have grown more than, broadly, 10% year-on-year. Score 0 otherwise.
How to Read the Final Score
Sum the six binary flags. The interpretation in Montier’s original work:
- 0–1: Clean. No earnings-manipulation signature on the standard forensic axes.
- 2–3: Watch list. The company is not yet a red flag, but two or more of its working-capital lines are behaving in ways that deserve a re-read of the notes to accounts.
- 4–6: High risk. Montier’s back-test found that this cohort produced returns dramatically worse than the market, with a meaningfully higher subsequent failure rate.
The model is not infallible. A high score can occur for innocent reasons (an acquisition that genuinely adds value, a one-off inventory build before a product launch, a deliberate channel-financing programme). But that is exactly the point — the score does not declare a verdict; it tells you where to read the annual report next. Forensic models are flashlights, not gavels.
Two Contrasting Profiles — A Disciplined Manufacturer Versus a Generic Red-Flag Profile
Consider, in stylised form, two Indian mid-cap industrials, both reporting revenue of around ₹500 crore.
Company A — disciplined manufacturer. Its CFO over the trailing four quarters runs at roughly the same level as net income, sometimes a few percentage points above. Trade receivables are stable at about 50 days of sales — the same number it reported four years ago. Inventory days have actually shortened slightly, because the company moved to a make-to-order model in two of its three plants. Other current assets are 4% of revenue, the same as last year. Depreciation as a fraction of gross block has been steady at about 7%. Total assets have grown 6% year-on-year, primarily reflecting retained earnings ploughed back into a small capacity expansion. The Modified C-Score for Company A is 0/6. Every line on the balance sheet behaves the way an honest, cash-generating manufacturer’s lines should behave.
Company B — a generic red-flag profile. Reported net income has grown 28% year-on-year, but CFO has actually fallen by 14%. Trade receivables have ballooned from 65 days to 110 days. Inventory days have crept up from 80 to 115. “Other current assets” has expanded from 5% of revenue to 11%, with the notes vaguely describing the build-up as “advances recoverable in cash or in kind.” Depreciation has dropped from 8% of gross block to 5% after management extended useful lives on plant and machinery. Total assets are up 36% year-on-year, almost entirely from a debt-funded acquisition that the company has not yet impaired. Modified C-Score for Company B: 6/6. Six independent signals saying the same thing — earnings are not what they appear.
The pedagogical point is not that every 6/6 company is committing fraud. It is that when six unrelated lines on the balance sheet all bend in the direction that flatters reported profit, the probability that all six are coincidences is essentially zero. Disciplined long-term investors learn to walk away from that profile and re-allocate to the Company A profile, where the lines all tell the same boring, cash-backed story.
Titan Biotech FY25: What the Numbers Reveal
The published FY25 audited financials of Titan Biotech Limited (BSE: 524717) — a Bhiwadi-headquartered specialty biotechnology manufacturer of microbial culture media, peptones, collagen and gelatin, selling to pharma and biotech customers across 60+ countries — give us a clean working illustration of what each of the six C-Score variables looks like in a small-cap that has clearly chosen earnings quality over earnings cosmetics. This is an educational illustration only, not a buy/sell recommendation.
| Modified C-Score Variable | What Would Score “1” (Red Flag) | Titan Biotech FY25 Audited Reading | Flag |
|---|---|---|---|
| 1. Divergence between NI and CFO | CFO running materially below net income | CFO / Operating Profit ≈ 103% — cash generation slightly exceeds operating profit | 0 |
| 2. Growing DSO | Receivable days expanding year-on-year | Working capital cycle disclosed and funded internally; no incremental external borrowing taken to support working capital expansion | 0 |
| 3. Growing DSI | Inventory days expanding year-on-year | FY25 revenue arc rising ~₹46.5 Cr → ₹54 Cr → ₹56 Cr → ~₹58 Cr without an inventory bloat marker; full-year revenue ~₹214 Cr against gross block of ~₹57 Cr | 0 |
| 4. Other current assets vs revenue | Build-up in “other current assets” outpacing sales | No “advances recoverable” or unbilled-revenue swell disclosed; balance sheet is dominated by tangible inventory, receivables and cash equivalents | 0 |
| 5. Depreciation / Gross Block | Falling depreciation as fraction of gross block | Depreciation / Gross Block ≈ 7% (FY25) — in line with Schedule II indicative useful lives for plant and machinery; no signs of life-stretching | 0 |
| 6. High total asset growth | Total assets up >10% year-on-year, debt-funded or acquisition-led | Asset growth funded essentially out of retained earnings; total borrowings ~₹3 Cr (effectively debt-free); CWIP ~₹11 Cr on gross block of ~₹57 Cr reflects organic, self-funded capex pipeline | 0 |
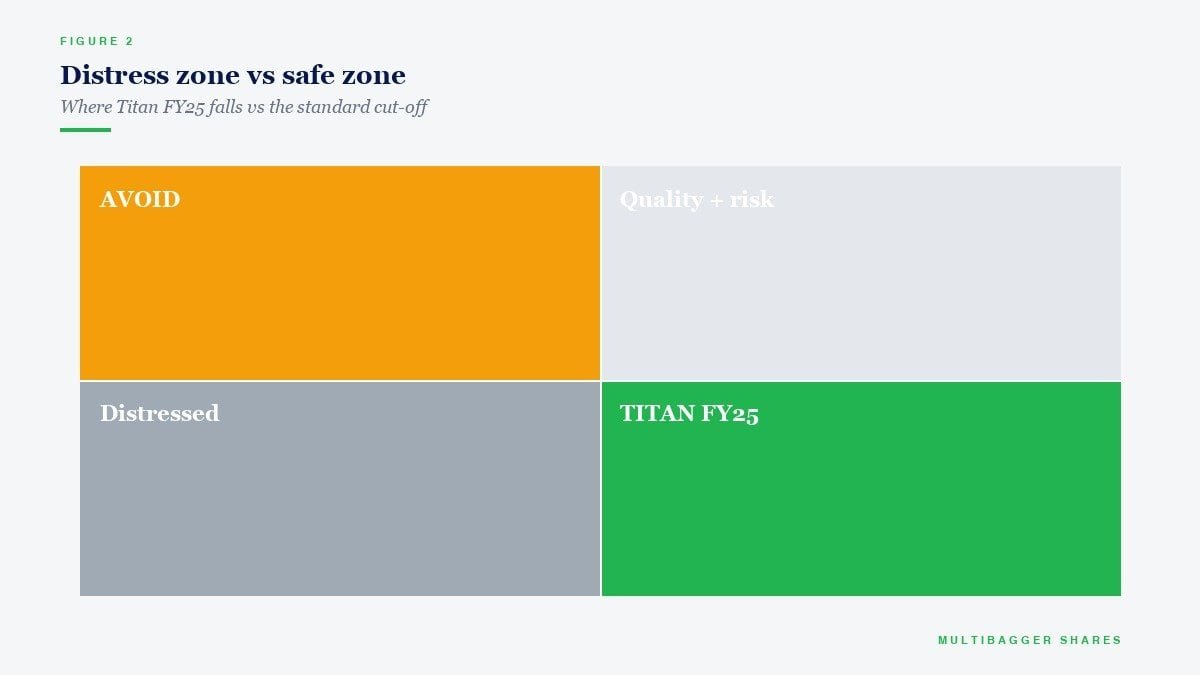
| Modified C-Score (FY25 audited) | 0 / 6 | ||
What the audited markers add up to is the textbook signature of an earnings-clean small-cap manufacturer. The cash conversion ratio of 103% CFO/Operating Profit alone closes the door on Variable 1 — there is no gap between reported profit and bank-confirmed operating cash. Variable 5 — depreciation at about 7% of a ~₹57 crore gross block — sits comfortably inside the band that Schedule II of the Companies Act, 2013 would expect for the kind of plant-and-machinery, lab equipment and biotech infrastructure Titan operates. Variable 6, asset growth, is funded out of internal accruals — with total borrowings of just ~₹3 crore against a strong net worth and contingent liabilities of only ~₹7.78 crore, the company is not borrowing to grow the balance sheet. The CWIP of ~₹11 crore represents capex-in-progress for the next leg of growth — a self-funded, disclosed pipeline rather than an acquisition-led leap.
The decade-long backdrop reinforces the read. Titan’s 10-year revenue CAGR of approximately 15% paired with a 10-year PAT CAGR of approximately 29% tells you that operating leverage — not accounting leverage — has been the engine of compounding. Earnings have been growing faster than revenue because margins have expanded honestly through scale and mix, not because depreciation was stretched or working-capital lines were inflated. Governance reinforces the financial picture: 14 board meetings in FY25 (against the SEBI LODR Regulation 17(2) minimum of four), an independent chairperson, and a conservative director remuneration bill of about ₹4.56 crore against a PAT base that is fully cash-backed. These are the institutional substrates that produce a 0/6 C-Score year after year — not luck.
Once again: this is an educational illustration of what a disciplined small-cap profile looks like on a specific forensic model. It is not a buy/sell recommendation on Titan Biotech or any other stock.
How Indian Retail Investors Should Actually Use the Modified C-Score
The C-Score is best used as a filter, not a verdict. The discipline an Indian long-term investor should adopt is roughly the following.
Step 1 — Compute the six flags from the annual report. Every input you need is in the audited annual report. Net income and CFO sit in the standalone profit and loss account and the cash flow statement. DSO is computed as (trade receivables × 365) / revenue. DSI is (inventories × 365) / cost of goods sold. Other current assets / revenue is a single division. Depreciation / gross block is a second single division. Total asset growth comes from the balance sheet two-year comparison. Even with no spreadsheet skill, a careful reader can run this scoring on any Indian listed company in roughly twenty minutes.
Step 2 — Stack the C-Score on top of Beneish M-Score and Piotroski F-Score. The three models are deliberately built to look at different angles. A small-cap that scores 0/6 on Montier, comfortably in the “unlikely manipulator” zone on Beneish, and 7+ on Piotroski has cleared three independent forensic filters. That is a much stronger statement than passing any single one. NSE itself, in its Annual Survey of the Indian Securities Market 2024, notes the explosion of micro-cap and small-cap listings — the case for forensic stacking has never been more urgent.
Step 3 — Use a falling C-Score over time as a positive signal, and a rising one as a warning. A single year’s score is informative; a trend is decisive. A company moving from a 4/6 to a 1/6 across three years is cleaning up. A company drifting from 1/6 to 4/6 deserves a follow-up question on every single quarterly call.
Step 4 — Never use C-Score to short. Montier himself cautioned that the model is a tool for screening longs out, not for sizing shorts. The Indian context reinforces this: SEBI’s 2024 study showed that 93% of individual F&O traders lost money. The honest application of C-Score is to avoid the wrong long-only positions, not to bet against management teams using leveraged derivatives.
Common Misinterpretations Indian Investors Make
Three failure modes recur in retail forensic analysis.
Mistake 1: treating a single flag as fatal. Variable 2 can score 1 simply because a fast-growing exporter offered slightly longer credit terms to a new geography. That alone is not a manipulation signature. The model is built around the co-occurrence of multiple flags — six independent flags simultaneously bending the same way is the actual warning signal.
Mistake 2: mistaking the C-Score for a valuation tool. A 0/6 score does not make a company cheap. It tells you the reported numbers are likely to be honest. A company can be earnings-clean and richly priced; a company can also be earnings-cooked and statistically cheap. Forensic models pair with valuation tools (P/E, EV/EBITDA, owner earnings, reverse DCF) — they do not replace them.
Mistake 3: ignoring the qualitative wraparound. The C-Score is a quantitative model. It does not see related-party transactions, auditor changes, qualifications in the auditor’s report, sudden CFO resignations, or off-balance-sheet exposures buried in the notes. Indian forensic discipline — particularly after the high-profile small-cap accounting events of the last decade — requires reading the qualitative disclosures around the score, not just the score itself.
Key Takeaways
- The Modified C-Score is a six-variable forensic flashlight that catches the accruals and working-capital signatures of earnings management — complementary to, not a substitute for, Beneish M-Score and Piotroski F-Score, both of which long-term Indian investors should also run on every watchlist candidate.
- Cheap-but-cooked is the most expensive trade in markets. SEBI’s own 2024 study found that 93% of individual F&O traders lost money, and India’s 11+ crore retail investor base is concentrated in small-caps where forensic discipline matters most — running a Modified C-Score before buying is one of the cheapest sources of edge a private investor has.
- Titan Biotech Limited (BSE: 524717) FY25 audited financials score 0/6 on the Modified C-Score, with cash flow from operations at approximately 103% of operating profit, depreciation at about 7% of a ~₹57 crore gross block, total borrowings of just ~₹3 crore, contingent liabilities of about ₹7.78 crore, CWIP of ~₹11 crore funded out of internal accruals, and a 10-year revenue CAGR of about 15% paired with a 10-year PAT CAGR of about 29% — the textbook signature of earnings quality in an Indian small-cap manufacturer. This is an educational illustration only, not a buy/sell recommendation.
- Use the C-Score as a filter, not a verdict. A single flag is informative; six simultaneous flags are decisive. Track the score as a trend across three to five years rather than fixating on a single snapshot, and pair the quantitative read with a careful look at related-party disclosures, auditor changes, and notes to accounts.
Disclaimer: This article is for educational and informational purposes only. It is not investment advice, and not a buy, sell, or hold recommendation on any stock mentioned, including Titan Biotech Limited. Equity markets carry risk; please do your own research or consult a qualified professional before making investment decisions.
