India’s retail investor base has gone from roughly 3 crore unique PAN holders at NSE in March 2019 to over 11 crore in 2025 — a near four-fold expansion in six years. Yet SEBI’s own landmark 2024 study on individual traders in the equity Futures and Options segment concluded that 93% of them lost money over FY22 to FY24, with aggregate net losses crossing ₹1.81 lakh crore. The chasm between participation and outcomes is not because Indian markets are rigged. It is because most retail investors spend their analytical energy on the wrong layer of disclosure — chart patterns, broker tips, quarterly EPS prints — and never reach the deeper layer where business quality is actually decided. That deeper layer is corporate governance, and within it, one of the most overlooked-yet-revealing micro-metrics is something every annual report publishes openly: the number of times the board of directors met during the year.
Why Board Meeting Frequency Is a Forensic Metric, Not a Compliance Footnote
For most Indian retail investors, the corporate governance section of an annual report is a wall of names, photographs and director qualifications. They flip past it on the way to the profit-and-loss statement. This is a tactical error. The governance section is where the operating discipline of a company is encoded in plain disclosure — and the single number that most cleanly summarises whether the board is genuinely engaged or merely ornamental is the count of board meetings held during the financial year.
Board meeting frequency answers a deceptively simple question: how often does the highest oversight body in the company actually convene to review strategy, capital allocation, risk and audited financials? A board that meets the bare regulatory minimum is signalling that it views governance as a compliance chore. A board that meets considerably more often — and engages each time with substantive agenda items — is signalling that it treats oversight as a continuing duty. Over a decade, that cultural difference compounds into the gap between a wealth-creating compounder and a stagnant value trap.
The Regulatory Floor: SEBI LODR Regulation 17(2) and Companies Act Section 173
Two parallel legal regimes set the minimum board meeting frequency for listed Indian companies. The first is the SEBI Listing Obligations and Disclosure Requirements (LODR) Regulations, 2015. Regulation 17(2) requires the board of every listed entity to meet at least four times a year, with a maximum time gap of 120 days between any two consecutive meetings. The second is the Companies Act, 2013. Section 173(1) prescribes the same arithmetic — minimum four board meetings each year — with the same 120-day-gap ceiling. The Companies Act adds that the first meeting must be held within 30 days of incorporation, but that detail rarely matters for listed firms whose tenure is measured in decades.
The cumulative legal floor is therefore exactly four board meetings per financial year. This is not a target. It is the absolute minimum below which a listed company would be in regulatory breach, exposing it to monetary penalties and, in extreme repeated cases, delisting proceedings. Treating four meetings as adequate is similar to treating the speed limit as a recommended cruising speed — technically legal, practically dangerous, and a poor signal about the underlying driver’s culture.
What does best practice look like? Anecdotal scans of S&P BSE 500 annual reports suggest the typical large-cap board meets between six and eight times a year. Quality-focused small and mid-cap boards, particularly in regulated industries such as pharma and specialty chemicals, often meet between eight and twelve times. The very top tier of governance — boards that treat oversight as a craft rather than a checklist — frequently land in the twelve-to-fifteen range. Above that, frequency starts to plateau because committees absorb routine work; what matters at that altitude is the substantive quality of each agenda.
How to Read the Disclosure: What the Annual Report Actually Tells You
The board meeting count appears in two places inside every Indian annual report. The first is the Corporate Governance Report, a standalone section mandated by SEBI LODR Schedule V, where companies disclose the dates of every board meeting, the attendance of each director, the gap between consecutive meetings, and the leave of absence record of any director who missed a meeting. The second is the Board’s Report (the directors’ report under Section 134 of the Companies Act), which references the same numbers in narrative form.
A diligent reader does not stop at the headline count. The forensic questions to ask, ranked in order of importance, are: (a) How many meetings did the board hold during the year? (b) What was the longest gap between any two consecutive meetings, and was it within the 120-day SEBI ceiling? (c) What was the average attendance of independent directors across all meetings? (d) Did any director attend fewer than 75% of meetings, and if so, why? (e) Did the audit committee meet at least four times during the year, with a maximum gap of 120 days (as required by LODR Regulation 18)? (f) Did the independent directors hold at least one separate meeting without the presence of non-independent directors, as mandated by LODR Schedule IV?
Each “no” answer to questions (b) through (f) is a small but real governance demerit. A pattern of “no” answers — say, low independent-director attendance combined with a missed independent-director-only meeting — is a serious red flag that often correlates with downstream accounting surprises.
Two Contrasting Illustrations: One Disciplined, One Disengaged
Consider two stylised examples, drawn from generic and historical patterns rather than living named stocks on the red-flag side.
The Disciplined Profile. A specialty chemicals small-cap with a ₹2,500 crore market cap reports 12 board meetings during FY25, with the longest gap between consecutive meetings being 47 days. Independent director attendance averages 96%. The audit committee meets seven times, and the independent directors hold one separate meeting in March without the chair or the MD present. The annual report devotes 14 pages to the corporate governance disclosure, with each board meeting agenda described in single-paragraph summaries. Over the previous decade, this company has compounded book value at roughly 18% per year, never carried borrowings above 0.2x equity, and never received a qualified audit opinion. The board meeting cadence is not the cause of the compounding — but it is a faithful proxy for the culture that produced it.
The Disengaged Profile. A consumer-durables small-cap reports the regulatory minimum of four board meetings, with one of the gaps stretching to 118 days — just inside the LODR ceiling. Two of the four independent directors attended fewer than 50% of meetings during the year; both took “leave of absence” each time. The audit committee met three times — one short of the LODR floor — and the company offered no explanation. The independent directors’ separate meeting was held on the same day as a regular board meeting, in 35 minutes. Over the following two years, the company restated three quarters of revenue, took a ₹140 crore inventory write-down it had previously denied, and saw its stock fall 70% before being suspended for non-compliance. The board meeting profile foreshadowed every one of those failures, and a reader who weighed the governance numbers honestly would have refused to buy in the first place.
The lesson is not that fewer meetings always equal trouble. It is that meeting frequency, taken together with the four forensic sub-questions above, is one of the cheapest and most predictive governance signals available to a private investor. It costs nothing to compute — every audited annual report carries the numbers — and it requires no specialist training beyond the ability to read a table.
Titan Biotech FY25: What the Numbers Reveal
Titan Biotech Limited (BSE: 524717) is a Bhiwadi-headquartered specialty biotechnology company whose products — peptones, microbial culture media, gelatin and collagen derivatives — feed into pharma, vaccine, biotech and food-science customers across more than 60 countries. The illustration below uses Titan Biotech’s FY25 audited numbers purely as an educational example of what a board-meeting-frequency profile looks like at a disciplined small-cap. This is not a buy/sell recommendation on Titan Biotech or any other stock.
| FY25 Audited Governance & Operating Marker (Titan Biotech) | Reading |
|---|---|
| Number of board meetings held during FY25 | 14 meetings — 3.5x the SEBI LODR Regulation 17(2) minimum of 4 |
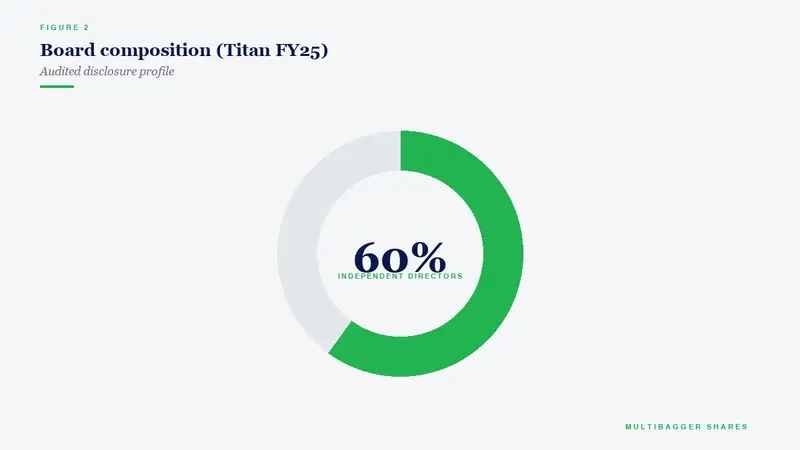
| Chairperson role | Independent chairperson — best-practice separation from Managing Director |
| Director remuneration FY25 | ~₹4.56 Cr — conservative absolute quantum relative to FY25 PAT |
| Total borrowings FY25 | ~₹3 Cr — essentially debt-free (D/E below 0.05x) |
| Contingent liabilities FY25 | ~₹7.78 Cr — modest relative to net worth |
| CFO/Operating Profit FY25 | ~103% — operating cash exceeds reported operating profit |
| Revenue FY25 (4-quarter sum) | ~₹214 Cr, with a quarterly arc of ₹46.5 Cr → ₹54 Cr → ₹56 Cr → ~₹58 Cr |
| Exports as % of FY25 revenue | ~34.5% — diversified across 60+ countries |
| Gross block FY25 / Capital Work-in-Progress FY25 | ~₹57 Cr gross block, ~₹11 Cr CWIP — visible reinvestment pipeline |
The fourteen board meetings number is the central educational data point. To meet 14 times in 365 days, the Titan board is convening on average once every 26 days. That cadence is consistent with a board that is genuinely involved in quarterly review, capex sign-off, investor disclosures, risk reviews, audit-committee work, treasury policy and CSR reporting — rather than a board that merely schedules the legal minimum and signs off on management decisions taken elsewhere. Combined with an independent chairperson (a Reg 17(1B) best-practice separation from the executive), the cadence suggests a board structure where oversight is allocated as time rather than as an annual ritual.
Equally important is what surrounds the meeting count. A board that meets 14 times is not, by itself, valuable. What makes the FY25 disclosure educationally interesting is that the high cadence sits alongside a clean balance sheet (~₹3 Cr borrowings against a strong net worth), high earnings-quality markers (CFO/operating-profit of about 103%, meaning the cash backed and slightly exceeded the reported operating profit), conservative absolute director remuneration (~₹4.56 Cr against FY25 PAT), and a quarterly revenue arc that climbed steadily from ₹46.5 Cr in the first quarter to roughly ₹58 Cr in the fourth. The frequency-of-oversight number co-exists with the financial fingerprints of disciplined operating execution. Whether causation runs from governance to execution or simply from a shared management culture is a question economists could debate; for a private investor, the practical takeaway is that the cluster of signals is consistent in the same direction, which is a calmer place to be than holding a stock where one signal contradicts the rest.
How Retail Investors Should Actually Use This Metric
The temptation, once you understand the regulatory floor, is to build a screen that ranks the entire BSE 500 by board meeting count and conclude that higher is always better. Resist the temptation. Board meeting frequency belongs inside a three-layer framework, not as a standalone ranker.
Layer one — exclusion. If a company shows fewer than the LODR-mandated four meetings during a year, that is a regulatory breach and a hard exclusion. If a company shows exactly four meetings with the maximum 120-day gap used to the millimetre, treat that as the lowest-effort possible compliance and assume the board is decorative until contradictory evidence emerges in the rest of the report. This is the equivalent of refusing to study companies that fail Piotroski points one through three: cheap, fast, and effective at eliminating the worst quartile of the universe.
Layer two — contextualisation. Compare a candidate company’s meeting count against its industry median. A bank holding company that meets six times a year may be perfectly engaged because the most material capital decisions move to ALM and credit committees. A specialty-chemicals small-cap that meets six times a year is meaningfully less engaged than a peer that meets ten or twelve. Industry context is essential because committee architecture varies sharply across sectors.
Layer three — corroboration. Once you have a candidate with a healthy meeting count, walk through the four forensic sub-questions: longest inter-meeting gap, average independent-director attendance, audit-committee meeting count under Reg 18, and whether the independent directors held a separate meeting under Schedule IV. A clean profile across all four is a strong corroborative signal. A single inconsistency — for instance, 12 board meetings but only three audit-committee meetings — is a thread worth pulling at, because the audit committee is where forensic accounting work happens. If management is generous with board meetings but stingy with audit-committee meetings, the cadence may be performance rather than substance.
The most important point is the one investors most often forget: this metric is descriptive, not prescriptive. It tells you what the board did during the year. It does not, on its own, tell you whether the next year’s earnings will compound. It is a filter that helps you screen out the bottom 10-20% of governance profiles cheaply, so that the time you spend on deep work — annual report study, channel checks, valuation modelling — is concentrated on businesses whose oversight infrastructure does not contradict their narrative.
Common Traps and Misinterpretations
The first trap is confusing frequency with engagement. A board can meet 20 times and rubber-stamp every decision. Conversely, a board that meets six times can do genuine work if each meeting carries a thick agenda and an active audit committee. The cure is to read at least three consecutive years of corporate governance reports and look for trend stability rather than single-year spikes.
The second trap is forgetting that committee meetings absorb work. Many large-cap boards meet six or seven times in plenary session because audit, risk, nomination-and-remuneration, and stakeholders’ relationship committees together meet 25 or more times during the year. Counting only the plenary board meetings would understate the oversight intensity by a wide margin. Always read the committee meeting tables that accompany the board meeting count.
The third trap is over-weighting the metric in cyclical or commodity sectors. Boards in cement, steel or oil refining sometimes meet less frequently in plenary precisely because they have delegated tactical operating reviews to highly engaged committees and CEO-level councils. Cross-sector comparisons are fragile; within-sector comparisons are the right unit of analysis.
The fourth and most consequential trap is treating board meeting frequency as a substitute for substantive governance scrutiny. A board can meet 14 times, have an independent chair, and still have related-party transactions that quietly transfer economic value to promoter entities. The cure here is not to abandon the metric, but to combine it with the other four governance forensics that this publication has covered separately: chairperson independence, director remuneration as a percentage of PAT, contingent liabilities exposure, and related-party transactions intensity. The full mosaic is what protects you. No single tile does.
The Indian Investor Context: Why This Matters Now
India’s retail equity participation has expanded from roughly 3 crore unique PAN holders at NSE in 2019 to more than 11 crore in 2025. Mutual fund SIP inflows crossed ₹26,000 crore in a single month for the first time in 2025. The deepening of domestic capital — both direct and through pooled vehicles — has put a much larger pool of long-term household savings at the mercy of corporate governance quality. SEBI’s tightening of the LODR framework, the introduction of the Independent Directors’ database and proficiency examination, and the renewed audit-committee independence rules under the 2023 amendments are all attempts to lift the floor. But regulators set floors. Private investors must demand ceilings.
The single cheapest ceiling-setting habit a long-term investor can adopt is this: before buying any small-cap or mid-cap stock, open the most recent corporate governance report, find the board meeting count, read the attendance table, count the audit-committee meetings, and verify that an independent-directors-only meeting took place. The entire exercise takes under fifteen minutes and removes a meaningful slice of avoidable risk from the portfolio.
Key Takeaways
The four points worth carrying away from this discussion are:
- The legal floor is four board meetings per year with a maximum 120-day gap (SEBI LODR Reg 17(2) and Companies Act Section 173). Anything below is a breach; anything at the floor is the lowest signalling tier.
- Best-practice Indian boards meet eight to twelve times a year, and top-tier governance profiles often land in the twelve-to-fifteen range, with active audit-committee and independent-director-only meetings layered on top.
- Frequency is necessary but not sufficient. Always combine the count with the four forensic sub-questions on inter-meeting gap, independent-director attendance, audit-committee cadence under Reg 18, and Schedule IV independent-directors-only meetings.
- Titan Biotech FY25 illustrates the disciplined end of the spectrum with 14 board meetings — 3.5x the SEBI minimum — sitting alongside an independent chairperson, ~₹3 Cr total borrowings, ~₹4.56 Cr director remuneration, and a CFO/operating-profit ratio of about 103%. This educational illustration is not a buy/sell recommendation on Titan Biotech or any other stock.
The metric is small. The discipline behind it, when present, is not.
Disclaimer: This article is for educational and informational purposes only. It is not investment advice, and not a buy, sell, or hold recommendation on any stock mentioned, including Titan Biotech Limited. Equity markets carry risk; please do your own research or consult a qualified professional before making investment decisions.
