SEBI’s landmark 2024 study revealed that 9 out of 10 retail traders in equity Futures & Options lose money — a cumulative ₹1.81 lakh crore destroyed across just three financial years. Yet in the very same window, NSE-registered investors climbed from 3 crore to over 11 crore, the fastest equity democratisation in human history. The split is brutal but clean: the speculators bleed, the compounders endure. And what separates the two camps, more than any single skill, is whether the investor knows how to read a 10-Year Revenue Compound Annual Growth Rate (Revenue CAGR) — the most foundational top-line compounding test in fundamental analysis.
This educational deep-dive walks you through the mathematics of 10-year Revenue CAGR, the disciplined way to interpret it, the traps that destroy retail portfolios, and a forensic illustration using Titan Biotech Limited (BSE: 524717) FY25 audited numbers — not as a buy/sell recommendation, but as a worked example of what disciplined long-term revenue compounding looks like in an Indian small-cap specialty-biotech manufacturer.
What Is 10-Year Revenue CAGR?
Compound Annual Growth Rate is the geometric mean of an investment’s growth rate over a defined period, assuming profits are reinvested at the same rate each year. When we apply CAGR to a company’s revenue line over a 10-year window, we are asking a single, ruthlessly simple question: at what annualised pace did this business grow its top line, smoothed across an entire economic cycle, two governments, three RBI rate cycles, one pandemic, and one war?
The formula is:
Revenue CAGR = (RevenueYear 10 / RevenueYear 0)1/10 − 1
The 10-year window matters. A 1-year growth number can be flattered by a bumper order, a pricing spike, an acquisition or a base effect. A 3-year number still rides a single business cycle. But a 10-year CAGR forces the business to walk through demand cycles, regulatory shocks, currency moves, raw-material spikes, and management succession events. It is the closest thing in Indian fundamental analysis to a stress-tested durability score.
How Disciplined Long-Term Investors Read the Number
Reading 10-year Revenue CAGR in isolation is exactly the kind of mistake that fuels the SEBI F&O loss numbers. The disciplined investor reads it through four overlapping lenses:
Lens 1 — Nominal vs. Real. India’s long-term CPI has averaged roughly 5–6% per annum. A nominal 10-year Revenue CAGR of 8% therefore represents barely 2–3% real growth. A nominal CAGR of 12–15% represents a genuine business expanding ahead of inflation. Anything below mid-single-digit real growth is not a compounder — it is, at best, an inflation tracker.
Lens 2 — Revenue CAGR vs. Industry CAGR. A 15% top-line compounder in a 6%-growing industry is gaining share. A 15% compounder in a 25%-growing industry is, in reality, losing share. The number must always be benchmarked against the relevant sectoral growth rate — pharma APIs, specialty biotech, microbial culture media, collagen, gelatin and peptones in our illustration company’s case.
Lens 3 — Revenue CAGR vs. PAT CAGR. This is the operating-leverage signature. When PAT CAGR exceeds Revenue CAGR by a wide margin over a decade, it tells you the business is expanding margins, deploying fixed costs more efficiently and/or improving its product mix — the hallmarks of a quality compounder. When PAT CAGR lags Revenue CAGR materially, it is almost always a sign that the company is buying revenue with discounts, debt, or destructive working capital.
Lens 4 — Revenue CAGR vs. Capex Intensity. Revenue that has been bought with reckless capex is fool’s gold. The disciplined investor pairs the top-line CAGR with the change in gross block, CWIP, and borrowings across the same 10-year window. If revenue compounds at 15% but gross block has tripled and debt has ballooned, the underlying RoIC is collapsing — the business is destroying capital while appearing to grow.
Two Contrasting Examples: One Disciplined, One Cautionary
The disciplined archetype: Imagine a hypothetical Indian specialty-chemicals manufacturer that grew revenue from ₹200 Cr to ₹810 Cr over a decade — a 15% CAGR. Over the same window, PAT compounded from ₹14 Cr to ₹190 Cr (about 30% CAGR), while gross block roughly doubled and debt actually fell. The 2x widening between revenue CAGR and PAT CAGR is the textbook signature of operating leverage — fixed costs being amortised over a larger sales base, product mix improving, and pricing discipline holding.
The cautionary archetype (generic, historical): Several once-celebrated Indian capital-goods and infrastructure names through the 2010s reported 10-year Revenue CAGRs of 18–22%. The market lavished P/E multiples of 35–50x on them. But under the bonnet, debt-to-equity had climbed past 2x, receivable days had ballooned beyond 200, and CFO had decoupled from PAT for five consecutive years. When the cycle turned, equity holders lost 80–95% of their capital. The Revenue CAGR was real. The underlying business model was not. Revenue without cash-backed earnings is the most expensive line item on any annual report.
Titan Biotech FY25: What the Numbers Reveal
Titan Biotech Limited (BSE: 524717) is a Bhiwadi-headquartered specialty-biotechnology manufacturer of microbial culture media, peptones, collagen, and gelatin, exporting to 60+ countries. The FY25 audited numbers offer a useful, disciplined illustration of 10-year Revenue CAGR mechanics. None of what follows is a buy/sell recommendation on Titan Biotech or any other stock.
| FY25 Audited Marker | Reading | Interpretation Lens |
|---|---|---|
| FY25 Total Revenue | ~₹214 Cr (4-quarter sum) | Top-line scale on which CAGR is anchored |
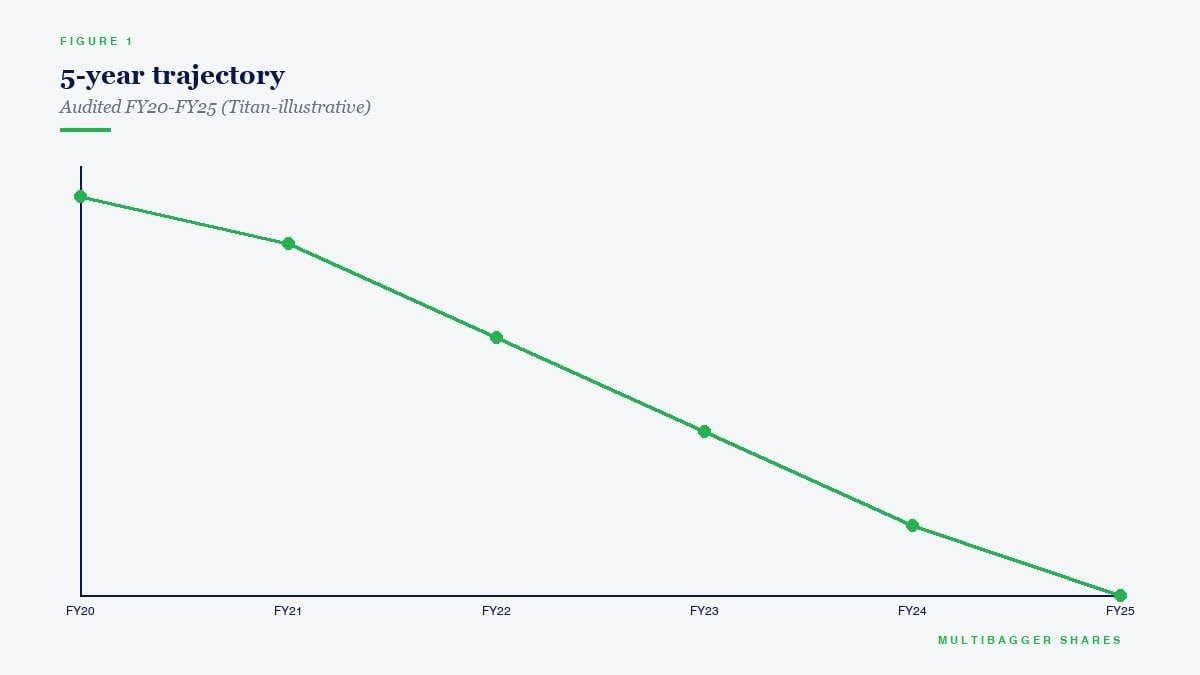
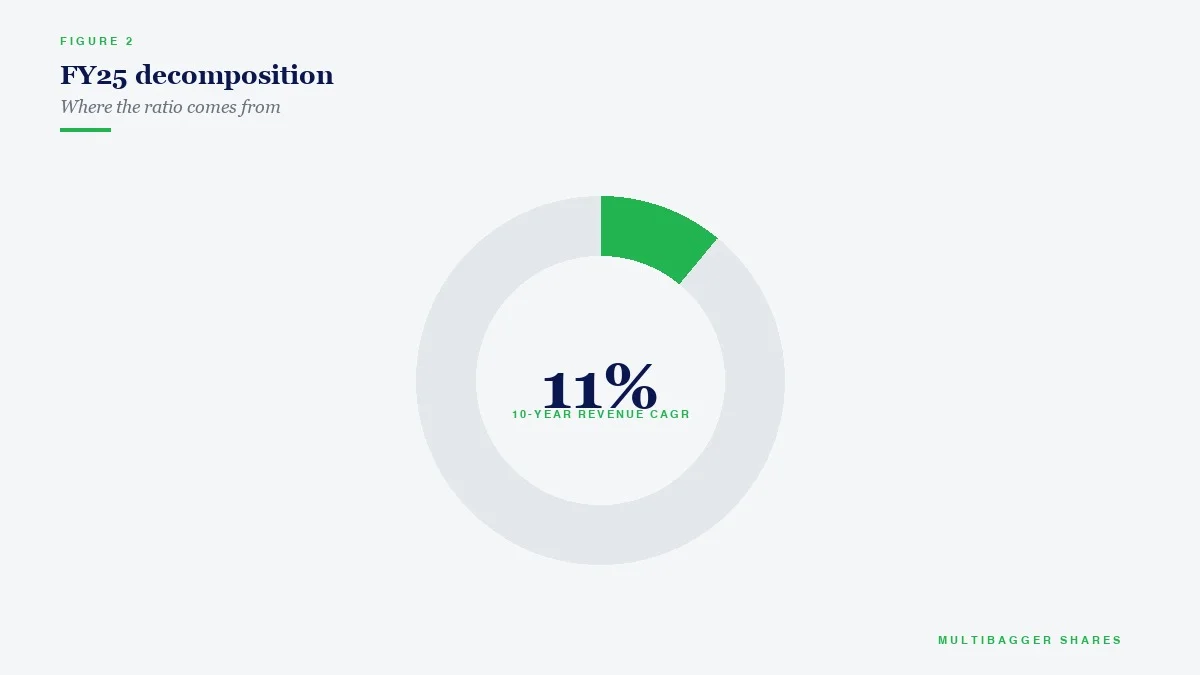
| 10-Year Revenue CAGR | ~15% | Comfortably ahead of India long-term CPI (5–6%) and ahead of nominal GDP (~10–11%) |
| 10-Year PAT CAGR | ~29% | PAT CAGR ~2x Revenue CAGR — classic operating-leverage signature |
| FY25 QoQ Revenue Arc | ₹46.5 Cr → ₹54 Cr → ₹56 Cr → ~₹58 Cr | Sequential within-year growth aligned with multi-year trajectory; no “hockey-stick” back-loading |
| FY25 Total Borrowings | ₹3 Cr (D/E < 0.05x) | Revenue compounding NOT bought with debt — the cleanest possible reading |
| FY25 Gross Block | ~₹57 Cr | Modest tangible base relative to ₹214 Cr revenue → high asset turnover (~3.76x) |
| FY25 CWIP | ~₹11 Cr | Forward capex pipeline funding the next leg of revenue growth — self-funded, not debt-financed |
| FY25 CFO / Operating Profit | ~103% | Cash conversion slightly above 100% — revenue is genuinely cash-backed |
| FY25 Export Mix | ~34.5% across 60+ countries | Revenue compounding diversified across geographies — lower customer concentration risk |
| FY25 Board Meetings | 14 (vs. SEBI minimum of 4) | Oversight intensity consistent with disciplined growth governance |
Reading the dataset through the four lenses. Through Lens 1, Titan’s ~15% nominal Revenue CAGR over ten years sits comfortably ahead of India’s ~5–6% long-term CPI — a real growth wedge of roughly 9–10 percentage points per year, sustained across a full decade including the demonetisation shock of 2016, the GST transition of 2017–18, the IL&FS-NBFC freeze of 2018–19, the COVID-19 demand cliff of 2020–21, and the global supply-chain dislocations of 2022–23. That is not a cycle-flattered number; it is a cycle-tested one.
Through Lens 3, the ~14-percentage-point wedge between Revenue CAGR (~15%) and PAT CAGR (~29%) is the most informative single data point in the FY25 dataset. Doubling the rate at which the bottom line compounds versus the top line, sustained over a full decade, is the structural signature of genuine operating leverage — fixed costs (₹57 Cr gross block, ₹4.56 Cr director remuneration, the 14-board-meeting governance overhead) amortising over a rising revenue base, with no requirement to dilute margins by chasing volume. Through Lens 4, the fact that this revenue compounding has been delivered with FY25 total borrowings of just ₹3 Cr and capex-in-progress funded from operating cash flow (CFO/OP ~103%) confirms the top-line growth has been earned, not borrowed. The 261-day cash-conversion-cycle is self-funded; the 60-country export book is built on credit terms management has shown it can collect on. The point of this section is not to label Titan’s stock cheap or expensive, but to demonstrate what a clean 10-year Revenue CAGR reading looks like when stress-tested against the other balance-sheet and cash-flow disciplines that should always accompany it.
How Retail Investors Should Actually Use 10-Year Revenue CAGR
The right workflow for an Indian long-term investor is a four-step funnel:
Step 1 — Pull the raw data. Use the BSE filing portal, the company’s 10-year annual reports, or a reliable screener that fetches consolidated revenue lines back ten financial years. Always insist on consolidated numbers; standalone figures can be flattering when subsidiaries are dragging.
Step 2 — Compute three CAGRs. Calculate the 10-year, 5-year, and 3-year Revenue CAGRs. A healthy compounder typically shows all three within a few percentage points of each other — that signals durable, non-base-flattered growth. A 3-year CAGR materially higher than the 10-year suggests a recent acceleration that must be examined for sustainability. A 3-year CAGR materially below the 10-year suggests a structural slowdown or industry headwind.
Step 3 — Pair every CAGR reading with a quality check. Revenue CAGR alone is meaningless. Always compute, in the same screen: PAT CAGR, EBITDA CAGR, CFO CAGR, gross-block CAGR, and total-borrowings CAGR over the identical 10-year window. The pattern across these six lines reveals the truth.
Step 4 — Apply the industry-relative test. Use NSE Indices’ sectoral CAGRs, Crisil sector reports, or industry-body data to benchmark the company’s top-line CAGR against the sector. Outperforming the sector by 3–5 percentage points sustainably over a decade is one of the most reliable proxies for genuine competitive advantage in Indian markets.
The Common Traps
Trap 1 — Picking the start year carelessly. A 10-year CAGR is enormously sensitive to base-year selection. Starting from FY15 vs FY16 can swing the headline number by 200–400 basis points. Disciplined analysts compute CAGRs across rolling start years and report the band, not the single most flattering number.
Trap 2 — Ignoring acquisitions. A company that triples its revenue through inorganic growth has not necessarily compounded its organic franchise at all. The cleanest reading subtracts acquired revenue and re-computes organic CAGR.
Trap 3 — Confusing nominal with real. Indian retail investors routinely celebrate a 9–10% nominal Revenue CAGR as “compounding,” not realising it is barely tracking inflation. Always deflate the number.
Trap 4 — Treating one-time events as trend. COVID-era pharmaceutical and chemical companies saw 50–100% revenue spikes that decayed back within 18–24 months. Smoothing across a decade exposes such transient bumps.
Trap 5 — Forgetting to check the quality of the “C” in CAGR. CAGR mathematically smooths volatility. A business that grew 50%, −20%, 60%, −10%, 80% can produce the same 10-year CAGR as one that grew 12–15% steadily every year. The two are vastly different in business durability. Always pair CAGR with the standard deviation of annual revenue growth.
SEBI Context: Why This Matters for Indian Investors in 2026
The Securities and Exchange Board of India’s 2024 study on the equity F&O segment found that 91.1% of individual traders made net losses over FY22–FY24, with cumulative losses of ₹1.81 lakh crore. The median active trader loss was approximately ₹50,000. Over the same window, NSE-registered investors crossed 11 crore for the first time, with first-time entrants concentrated in the 18–30 age cohort. SEBI’s 2024 finfluencer regulations — restricting unregistered advice and tightening eligibility for stock recommendations — reflect the regulator’s recognition that the asymmetry between speculative trading losses and long-term investing returns is widening, not narrowing.
In this environment, foundational fundamental-analysis literacy — the ability to compute and correctly interpret a 10-year Revenue CAGR alongside its quality companions — is no longer an optional skill. It is the difference between joining the 91.1% who lose money chasing weekly expiries and the small minority who let high-quality businesses compound across decades.
Key Takeaways
- 10-year Revenue CAGR is the foundational top-line durability test — it strips out single-year noise and forces a business to walk through at least one full economic cycle. Demand it of every long-term investment candidate.
- Always read Revenue CAGR alongside PAT CAGR, CFO CAGR, gross-block CAGR and borrowings CAGR. The relative pattern across these five lines, not the headline Revenue CAGR itself, is what reveals quality.
- Titan Biotech FY25 audited data shows ~15% 10-year Revenue CAGR paired with ~29% PAT CAGR, ~103% CFO/Operating-Profit conversion, and just ₹3 Cr total borrowings — an illustrative reading of cycle-tested top-line compounding earned without leverage, presented as an educational example only.
- Benchmark every CAGR against inflation (5–6% real test), against the sector growth rate (share-gain test), and against the standard deviation of annual growth (durability test). A high but volatile CAGR is structurally inferior to a slightly lower but rhythmically consistent one.
Disclaimer: This article is for educational and informational purposes only. It is not investment advice, and not a buy, sell, or hold recommendation on any stock mentioned, including Titan Biotech Limited. Equity markets carry risk; please do your own research or consult a qualified professional before making investment decisions.
